Does your handover work on the client's site? Let the trace decide
A Playwright trace records every action and network request, so the client can open it and see for themselves how the flow ran.
In brief
- Playwright Test bundles a runner, assertions, isolation and parallel execution, installed with npm init.
- Trace Viewer shows the locator and duration of each action, DOM snapshots and every network request.
- Turn on tracing for the first retry in CI, then use the trace as evidence when a client asks whether the delivery works.
On Friday you finish the integration into the client’s web portal. On Monday the client messages you: “The request form doesn’t work.” You have a screenshot and your memory. They have an annoyed user.
The “works on my machine” argument is where an FDE loses credibility fastest, and it is exactly the problem Playwright solves. You write a test that walks through the whole flow as a real user would, and every run leaves a record that both sides can open and inspect.
For someone working inside a client’s systems, this is a deployment skill, not something to leave to the QA team. You need a repeatable way to say “this flow works” and to show the evidence.
What the tool is, and why this one?
Microsoft’s official documentation describes Playwright Test as an end-to-end testing framework for modern web apps. The GitHub repository, under the microsoft organisation and licensed Apache-2.0, describes it more broadly: a framework for web testing and automation.
For an FDE, the biggest advantage is that everything comes in one package: runner, assertions, isolation between tests, parallel execution and the accompanying tooling. You install it with npm init playwright@latest instead of stitching several libraries together on the client’s laptop. It runs on Chromium, WebKit and Firefox, on Windows, Linux and macOS.
So when the client has Safari users, or their IT team only gives you a Windows machine, you run the same test suite without rewriting it.
A minimal test for the flow you just delivered
Picture the flow you just shipped: the user signs in, fills in a request form, clicks submit and sees a confirmation message. The test only needs to follow that path:
import { test, expect } from '@playwright/test';

test('submits a request successfully', async ({ page }) => {
  await page.goto('https://portal.example.com/login');
  await page.getByLabel('Email').fill('[email protected]');
  await page.getByLabel('Password').fill(process.env.DEMO_PASSWORD!);
  await page.getByRole('button', { name: 'Sign in' }).click();

  await page.getByRole('link', { name: 'New request' }).click();
  await page.getByLabel('Details').fill('End-to-end check');
  await page.getByRole('button', { name: 'Submit' }).click();

  await expect(page.getByText('Request received')).toBeVisible();
});
There is not a single sleep in this test, and that is deliberate. Before performing an action, Playwright waits until the relevant actionability checks pass. If they still have not passed when the time runs out, it raises a TimeoutError. On a client page that loads slowly and is crowded with third-party scripts, this auto-waiting makes tests less flaky.
The last line is a web-first assertion. According to the best-practices guide, this kind of assertion waits until the expected condition is met. You check what the user sees, not internal details.
A trace is evidence, not just a debugging tool
Trace Viewer is a GUI tool for exploring recorded traces after a script has run. Justin Toniazzo of thoughtbot likens it to a DVR for your test runs, and argues that turning it on takes very little effort.
The official documentation recommends recording traces on CI on the first retry of a failed test. In the config, you only need a few lines:
// playwright.config.ts
import { defineConfig } from '@playwright/test';

export default defineConfig({
  retries: 1,
  use: { trace: 'on-first-retry' },
});
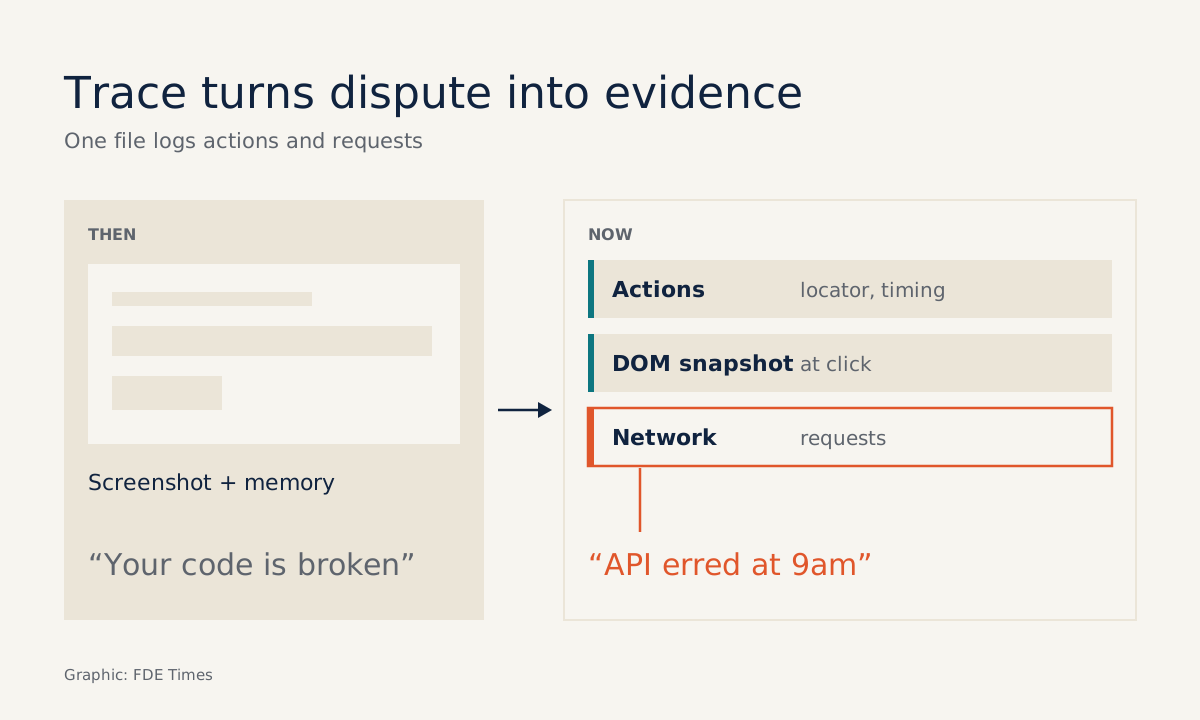
Back to that Monday message. You open the trace and go to the Actions tab, which shows the locator used for each action and how long each action took. Suppose clicking “Submit” used up almost the entire timeout. Now you have the right question to investigate.
Next, every action has a DOM snapshot, so you can see what the page looked like at the moment of the click. The Network tab lists every request made while the test ran. If the form submission returned an error from the client’s backend, the conversation shifts from “your code is broken” to “this API returned an error at 9 o’clock”, which is a technical matter both sides can work on.
You can open a trace locally with a CLI command, or use trace.playwright.dev, a statically hosted version of Trace Viewer that runs in the browser. That is handy when people on the client side do not have a Node environment installed.
Common mistakes when you first turn on tracing
The most common mistake is setting trace: 'on-first-retry' but forgetting retries. With no retries there is no “first retry”, so a failing test leaves no trace at all, precisely when you need one most. Check both lines in the config before trusting that CI is recording.
The opposite mistake is turning tracing on for every run, just to be safe. Each trace contains a DOM snapshot for every action and every network request, so recording the whole passing suite produces a pile of heavy files that almost nobody opens.
The third mistake goes back to the code above: adding sleep when a test is flaky. That hides the symptom and slows the suite down. Playwright already waits for actions to be ready, so when a test still fails, open the trace to see which step was slow rather than adding more seconds of waiting.
Limits to state plainly to the client
A passing test proves only that the flow worked in that environment, with that data, at that moment. It does not replace unit tests or production monitoring. Promise more than that and the trace itself will cost you credibility next time.
Because a trace contains DOM snapshots and network requests, it may well contain the client’s real data. Before uploading a trace anywhere or sending it over chat, ask about their data policy. Ideally, run tests with a demo account and fake data.
A TimeoutError also only tells you that a condition was not met, not why. The real work is still reading the trace and reasoning about it, and that skill takes practice.
What to learn first, and how to put it on your CV
A sensible order: role- and label-based locators, web-first assertions, trace configuration on CI, then reading the three things in a trace: Actions, snapshots and Network. Get these four solid before you think about parallel runs or multiple browsers.
When reading FDE job ads, look for passages about owning deployments end to end or debugging inside the client’s environment. That is where your Playwright story belongs.
A CV line such as “wrote end-to-end tests for the onboarding flow and used CI traces to pinpoint a bug in the client’s API” says far more than “knows Playwright”.
The next time a client asks whether your delivery works, you will not have to argue. You will send them a trace file.
Was this article useful?
Thanks for the feedback!