Monte Carlo for FDEs: let table monitors run themselves, write SQL rules for each client
Two kinds of monitor, one YAML file and one wrongly named namespace can decide whether the data alerts you hand over to a client keep working or quietly disappear.

In brief
- Table monitors catch broken and stalled pipelines, and for most integrations they work straight away with no configuration.
- Each client's business rules belong in validation monitors: pick a template or write your own SQL.
- Monitors as code lets you version and review rules, but every apply replaces all the monitors in a namespace.
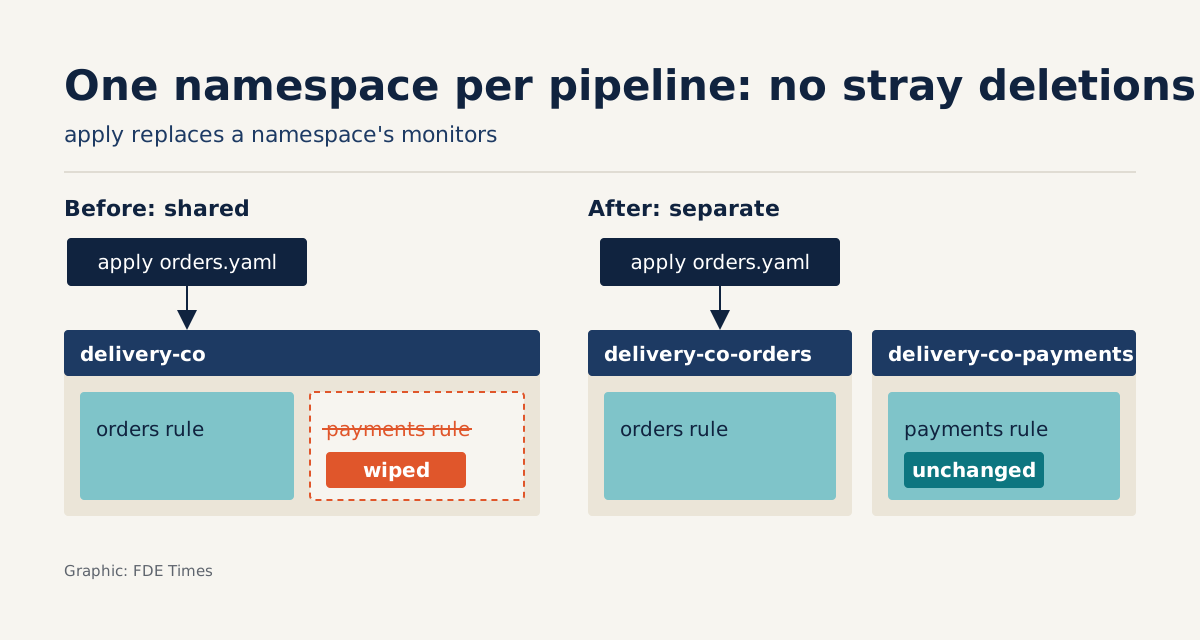
The most dangerous mistake with Monte Carlo is not a badly written SQL query. It is the apply command. According to the monitors as code documentation, each apply replaces every monitor in a namespace. Run it from client A’s repo into client B’s namespace and B’s alerts disappear without anyone noticing.
For an FDE, this operational detail matters more than any product slide. You are on site to make the client’s data trustworthy, then hand over a system that keeps working after you leave.
If the client already uses Monte Carlo, or you have been asked to set it up for them, the first job is to separate what the tool does by itself from what you have to write.
What runs by itself, and what do you have to write?
Table monitors are the built-in group that detects where data has broken or stopped flowing. The documentation says that for most integrations they work immediately, with no user configuration. In your first week at a new client you already have a basic safety net: if a table stops updating, someone will know.
But table monitors know nothing about the client’s business. They do not know that an order cannot be delivered before it was placed, or that revenue in the warehouse must match the payments system.
Rules like these belong in validation monitors. According to the documentation, you can choose a template or write your own SQL, and this type suits row-level checks, business-specific logic, or comparing metrics across several sources.
Monte Carlo’s own blog also describes SQL Rules as a way to add custom monitors for specific cases, complementing automated anomaly detection. Put simply: the automated part catches technical failures, while the part you write catches errors that only someone who understands the business would spot.
One rule for a delivery company
Imagine the client is a delivery company with an orders table. Through customer discovery you hear three rules the operations team treats as obvious: the delivery time cannot be earlier than the order time, a delivered order must have a driver ID, and the daily order total in the warehouse must match the payments system.
The first rule can be written as a SQL query that returns the offending rows themselves:
SELECT order_id, created_at, delivered_at
FROM orders
WHERE delivered_at < created_at
  AND created_at >= CURRENT_DATE - 1
Written this way, when an alert fires the on-call engineer opens it and sees exactly which orders are wrong, with no guessing.
The third rule is a cross-source metric comparison. Assuming payment data has already been loaded into the same warehouse in a payments table, a sketch might look like this, returning only the days on which the two sides disagree:
SELECT o.day, o.order_total, p.payment_total
FROM (
  SELECT DATE(created_at) AS day, SUM(amount) AS order_total
  FROM orders
  WHERE created_at >= CURRENT_DATE - 7
  GROUP BY 1
) o
JOIN (
  SELECT DATE(paid_at) AS day, SUM(amount) AS payment_total
  FROM payments
  WHERE paid_at >= CURRENT_DATE - 7
  GROUP BY 1
) p ON o.day = p.day
WHERE o.order_total <> p.payment_total
Both queries deliberately limit the time window: the first looks only at orders from yesterday onwards, the second compares the last seven days so you can see which day diverged. The reason is that MotherDuck’s integration documentation notes that query complexity and result size affect monitor performance.
A rule that scans the entire order history on every run will be slow and will burn the client’s resources, so limit the scope and return only the columns needed to handle an incident.
The workflow MotherDuck describes is also the right order of work at a client: connect the source first, then create custom SQL monitors for tables, for checking that data is updated on time, or for the metrics you need to track.
The client’s rules should live in Git
Creating rules by hand in the UI is fast but hard to hand over. Monte Carlo lets you define monitors as code in YAML; the CLI reads the YAML files and syncs the declared state to Monte Carlo. Each client’s rules then get versions, pull requests and a reviewer before they go live.
The sketch below only illustrates how a repo might be organised; check the exact field names and command syntax against the monitors as code documentation before use:
# monitors/delivery-co/orders.yaml
namespace: delivery-co-orders
monitors:
  - name: delivered_before_created
    type: validation
    sql: |
      SELECT order_id, created_at, delivered_at
      FROM orders
      WHERE delivered_at < created_at
        AND created_at >= CURRENT_DATE - 1
  - name: daily_revenue_matches_payments
    type: validation
    sql: |
      -- the cross-source query above
This is where the apply command from the opening matters. Because each apply replaces every monitor in the namespace, the documentation recommends a separate namespace for each team or pipeline. In the sketch above, the namespace carries both the client and the pipeline name, so a file from the payments team will never overwrite the orders team’s rules.
The documentation also restricts the --auto-yes flag, which skips the confirmation step, to CI environments. A sensible convention is for CI to run apply after a pull request is approved, while nobody skips confirmation on a personal machine. Settle the namespace naming convention on day one, before you write the second rule.
What to learn first, and what to put on your CV
The thing most worth learning is not Monte Carlo’s interface. It is the skill of turning a client’s remark such as “a delivered order must have a driver” into a SQL check that is testable, cheap to run and easy to read.
That skill carries over to any data quality tool, and it grows in value as Monte Carlo, now on the montecarlo.ai domain, describes itself as a tool for monitoring, troubleshooting and improving both AI agents and the data beneath them.
When reading FDE job descriptions, look for phrases such as data quality, observability, monitors as code or CI/CD for data. On your CV, do not just write “used Monte Carlo”. Say how many of the client’s business rules you encoded as monitors versioned in Git, and how you organised namespaces so several teams could work without stepping on each other.
Automated alerts tell you the pipeline is still running. The rules you leave in the repo are what tell the client’s team the data is still right, long after you have left the project.
Was this article useful?
Thanks for the feedback!