Ask five people where the data lives, get five answers
A seven-step inventory built in the first week with read-only access records each source's owner, lineage and usage limits before any pipeline or agent.
In brief
- Seven fields are enough at the start. The owner column must name a specific person.
- For each source, record whether it is batch or stream, whether it supports CDC and how sensitive it is. Those three things shape the pipeline design.
- The inventory needs regular reconciliation, at least quarterly in the early stages, and the name of the person on the client side who owns it after handover.
In your first week at a client, ask five people “where does the customer data live?” and you will probably get five different answers. Each one is partly right, and nobody has the whole picture.
Your first job is to collect those five answers in one file that the whole client team agrees on. IBM defines data ingestion as the process of collecting data from multiple sources for storage, processing and analysis. You cannot collect from a source that nobody has listed.
That makes the data source inventory the foundation for everything built later, from pipelines and dashboards to agents. The seven steps below build one from scratch. They follow a hypothetical client from start to finish, so you can watch the inventory fill up.
What you will have by the end of the week
The output is a spreadsheet, or a CSV file in the project repo, with one row per data source. GeekyAnts’ guide to data discovery sets the goal as a complete, trustworthy inventory in which every source has an owner, lineage and usage constraints.
You need three things: somewhere to store the file that both sides can see, a list of contacts on the client side, and read access to the systems you are allowed to look at. In the first week, ask only for read-only access. You are there to observe, not to change anything yet.
The running example is a hypothetical retail chain with three sources: the in-store POS system, a CRM, and a survey form the marketing team built themselves. Every row of data below is illustrative.
Step 1: start with few columns
On Monday morning the retail chain’s head of operations sends you a list of “the main systems”. It has exactly two names on it: POS and CRM. You will be tempted to open a sheet and add lots of columns straight away. Hold back.
According to IF4IT, an initial record needs only seven fields: ID, display name, description, structure, data type, domain and sensitivity classification. Beyond those seven, add a few columns that serve the deployment work directly, and leave them blank until you have the information.
The column names in the example are in Vietnamese. In order they mean: id, name, description, structure, type, domain, sensitivity, owner, ingestion type, CDC support, lineage, usage constraints, number of ingesting teams, quality note, schema drift risk.
id,name,description,structure,type,domain,sensitivity,owner,ingest_mode,cdc_support,lineage,usage_constraints,ingest_team_count,quality_notes,schema_drift_riskAfter day one, the first seven columns look like this (the rows describe POS orders as till transactions and the CRM as customer profiles and contact history, both still “unclassified” for sensitivity):
id,name,description,structure,type,domain,sensitivity
SRC-001,POS orders,In-store transactions,relational table,transactional,retail,unclassified
SRC-002,Customer CRM,Profiles and contact history,records with custom fields,customer,marketing,unclassified
Check before moving on: you must be able to fill the first six columns for every row. The sensitivity column says “unclassified” until Step 5. If you cannot describe a source in one sentence, you do not understand it yet. Flag it as a question.
Step 2: scan by source category, not from memory
The head of operations’ two-system list is almost certainly incomplete. To avoid gaps, use the four typical source categories Qlik lists as an interview checklist: databases, IoT devices, SaaS applications and data lakes. Go through each category with each department.
Press hardest on SaaS, because a tool a department signed up for on its own may not be in the list of systems you have been given access to scan. At the retail chain, the survey form only surfaces when you ask the marketing team “do you use any other SaaS apps?”, and the inventory gains a row: SRC-003,Survey form (survey form).
For the systems you do have access to, do not type things in by hand. GeekyAnts recommends using tools to build the initial catalogue, at roughly 80% automated and 20% manual. Scanning tools handle what can be read from the systems themselves: names, structures, data types.
The manual part covers what a machine cannot know on its own, such as who is responsible for a source or what it is used for. That only comes from interviews.
Step 3: every row needs a person’s name
Ask “who looks after the CRM?” and you get “IT”. That is not an answer. IF4IT requires every record to have its own Owner and Steward, and the inventory itself must have a named owner. Writing “IT department” or “data team” is as good as writing nothing.
id,owner
SRC-001,Nguyen Van A
SRC-002,Tran Thi B
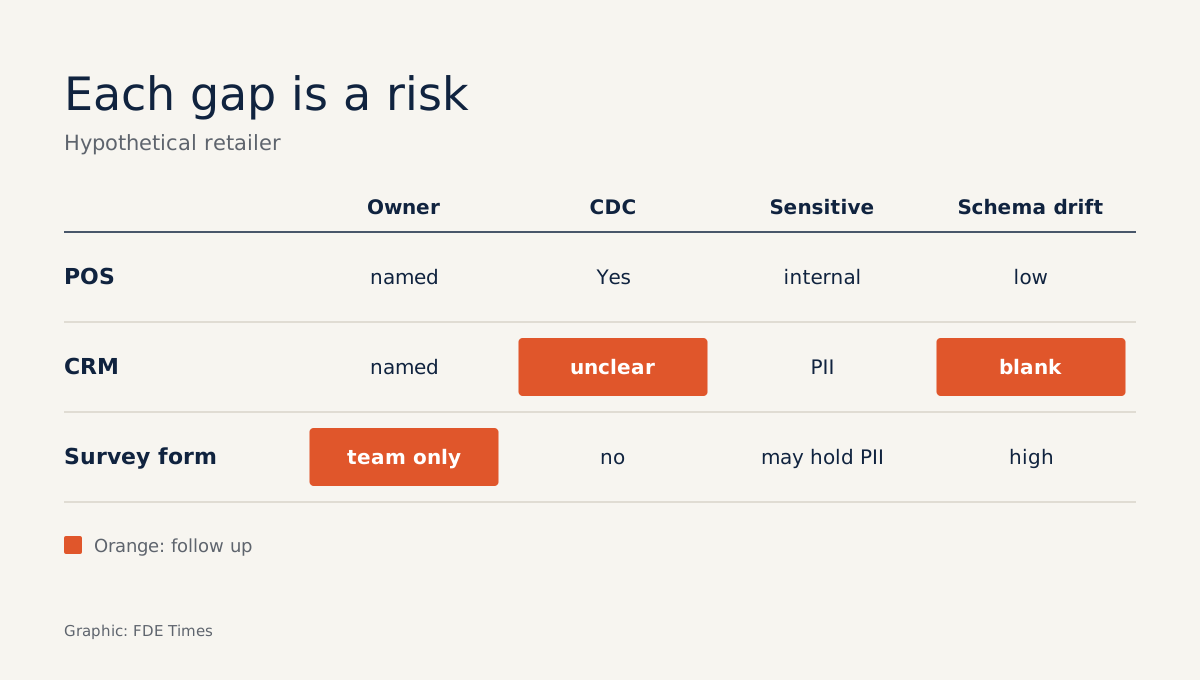
SRC-003,marketing teamCheck: filter the owner (owner) column and count the blank cells and the cells that only name a team. In the example above, SRC-003 fails. Turn rows like that into a list of questions for your meeting with the client’s project sponsor.
Step 4: batch or stream, and is there CDC?
The POS pushes transactions to the central warehouse almost immediately, while the CRM only exports a file each night. These two sources need two different kinds of pipeline. IBM distinguishes batch ingestion, which collects data and processes it in one pass, from real-time ingestion, which processes data as soon as it is generated.
The ingest_mode (ingestion type) column will therefore drive most of the later design. Alongside it, record which sources support CDC, the mechanism Qlik describes as tracking the transaction log so that only changed data moves to the target system:
id,ingest_mode,cdc_support,lineage
SRC-001,stream,yes,POS -> central warehouse
SRC-002,batch,unclear,CRM -> nightly export file
SRC-003,batch,no,form -> manually downloaded CSV file
Here “có” means yes, “không” means no, and “chưa rõ” means unknown. An “unknown” cell is not a mistake. It is one more question for the person named in Step 3.
Step 5: label every source for sensitivity
A colleague on the client side offers to send you “a sample CRM file so you can test quickly”. Do not accept it yet. According to IBM, the more data is exposed during ingestion, the greater the risk of sensitive data leaking, so the sensitivity (sensitivity) column is mandatory, even for sources that look harmless.
GeekyAnts recommends labelling every dataset for sensitivity and running automated PII/PHI detection tools, backed by manual review. In the example, the POS is only “internal”, the CRM holds phone numbers and email addresses so it is “PII”, and the survey form has free-text fields so it is provisionally marked “may contain PII”.
Do this before copying any data into a dev environment, not afterwards. Discovering customer phone numbers in a test file in week three is too late.
Step 6: find duplication and poor quality
In the interviews the CRM comes up three times: marketing, customer service and BI all say “we pull CRM data”. Qlik warns about exactly this situation: when several teams ingest from the same source, data easily becomes fragmented and duplicated.
The ingest_team_count column records how many teams pull data from a source. A value of 2 or more is a sign that several teams hold different copies of the same data. The CRM’s cell says 3, and that is the first risk worth raising. The names of the three teams can go in quality_notes (quality note).
Qlik also recommends building data quality and completeness checks into governance. At the inventory stage, you do not need detailed measurement. A one-sentence observation in quality_notes, such as “POS is missing the store code on some rows”, is enough to know what to measure later.
Step 7: record schema drift risk and schedule reconciliation
The marketing team mentions that they change the survey questions almost every month. That is a source of schema drift, which IBM describes as changes to the structure of source data, such as fields being added, removed or modified, that leave the source and target out of step.
Put each source into one of three levels, low, medium or high, based on a single question: does this source often change its columns without anyone giving notice? The survey form deserves high. The POS can probably be rated low.
The inventory itself will go stale too. IF4IT suggests reconciling at least quarterly in the early stages, then monthly or whenever a new integration is added as the organisation matures. Put this schedule in the handover documents and state clearly who on the client side will own it.
Mistakes that turn an inventory into a dead file
A common mistake is piling on columns from the start, then giving up by the tenth source. Another is recording owners as department names, or keeping the inventory on your laptop instead of somewhere the client can see and edit it.
The most dangerous mistake is treating the inventory as paperwork. Every blank cell is a project risk that nobody has named yet.
How the inventory helps you with the client and on your CV
Bring the inventory to the review at the end of the first week. It shows the client how well you understand their systems, and gives you grounds to say “this part can’t be done yet because the survey form has no owner”.
On your CV, do not just write “worked with data”. Be specific: how many sources you inventoried, how many duplicate ingestions you found, and that you labelled sensitivity before data left the client’s systems. That is also a concrete story to tell in interviews.
Pipelines can be rewritten and agents can be tuned. A source missed in week one may not surface until week ten.
Was this article useful?
Thanks for the feedback!