An agent's hours-saved dashboard starts before the agent runs
Traces tell you how many tasks an agent completed, but finance believes the hours saved only against a manual baseline measured before launch.
In brief
- Without a baseline measured before launch, there is no ROI to talk about; call it a pilot.
- Traces give you task counts, tool calls and tokens. The minutes saved per task have to come from manual measurement.
- Hours swallowed by human review, and hours not redeployed to other work, do not count.
You can sit in front of a Langfuse instance full of traces and still be unable to answer the one question the client’s CFO cares about: how many hours of work does this agent save? Traces record what the agent did. They do not record how long it used to take people to do the same thing by hand.
Fiddler’s guide to an agent ROI calculator is blunt: measure the baseline of the current process before the agent goes live. It also observes that finance teams will not trust estimates; they trust measured differences.
An hours-saved dashboard is therefore two measurements joined together: a table of manual timings taken before launch, and a counter driven by traces after launch.
This guide builds that counter, connects it to the baseline and puts the result on a per-customer board. The code is simplified: the span export format is an assumed JSONL layout, and all the numbers in the examples are illustrative.
What do you need?
You need an agent instrumented to the OpenTelemetry GenAI conventions, traces that can be exported to a file or already sit in Langfuse, and Python 3. The most important prerequisite is not on your laptop: you need permission to sit next to the people doing the manual process and time them.
MetaCTO, in its piece on what to measure before and after launch, advises that a team unable to establish a baseline can still run a pilot but should not yet talk about ROI. If the client has not let you measure, call the project a pilot from day one.
Step 1: measure the baseline by hand, do not estimate it
Pick one specific task type, such as support ticket triage. Time the people who actually do it, many times over, and take the median. After launch, keep measuring the minutes people still spend reviewing the agent’s output, and each week ask the client’s manager to confirm how many hours were actually reassigned to other work.
# baseline.py — manual measurements (illustrative figures)
BASELINE_MIN = {"ticket_triage": 12.0}  # measured before launch
REVIEW_MIN   = {"ticket_triage": 3.0}   # measured after launch, not guessed
# hours the client's manager confirmed were moved to other work, per week
REDEPLOYED_H = {("ticket_triage", "week_1"): 45.0}
Check: every number must trace back to a dated measurement session or confirmation with a named owner. If you cannot answer “where does this 12 come from?”, it is an estimate, and finance will not believe it.
Step 2: keep attribute names in one place
As Dash0’s explainer notes, the gen_ai.* attributes are still at Development stability: attribute names can change and span shapes can be restructured. Do not scatter these strings across your code.
# semconv.py — every gen_ai.* name lives here and only here
AGENT_SPAN = "invoke_agent"
TOOL_SPAN  = "execute_tool"
IN_TOK     = "gen_ai.usage.input_tokens"
OUT_TOK    = "gen_ai.usage.output_tokens"
TASK_TYPE  = "app.task_type"    # custom attribute, not part of the standard
CUSTOMER   = "app.customer_id"  # custom
Check: running grep -r "gen_ai\." . should return a single file. Pin the instrumentation library version too, so the conventions cannot shift silently between two deploys.
Step 3: one task is one root invoke_agent
Under the GenAI conventions, each agent run is an invoke_agent span, and a sub-agent is nested as another invoke_agent span. Count every invoke_agent span and a task with three sub-agents becomes four tasks. Only the outermost span is the task.
import json
from semconv import AGENT_SPAN, TOOL_SPAN, IN_TOK, OUT_TOK

spans = [json.loads(l) for l in open("spans.jsonl")]  # simplified format
by_id = {s["span_id"]: s for s in spans}

def is_agent(s):
    return s["name"].startswith(AGENT_SPAN)

# simplified: each span walks up to the root, costing O(tree depth)
def root_agent(s):
    top = s if is_agent(s) else None
    p = by_id.get(s.get("parent_id"))
    while p:
        if is_agent(p):
            top = p
        p = by_id.get(p.get("parent_id"))
    return top
The loop is easy to read, but with large traces and deep trees you should cache the root per span_id so each branch is walked only once.
Every tool call, including calls over MCP, is an execute_tool span. That lets you count the automated steps in each task, and summing the two usage attributes gives you token cost.
from collections import defaultdict
tasks = defaultdict(lambda: {"tools": 0, "tok": 0})
for s in spans:
    r = root_agent(s)
    if not r:
        continue
    t = tasks[r["span_id"]]
    if s["name"].startswith(TOOL_SPAN):
        t["tools"] += 1
    a = s.get("attributes", {})
    t["tok"] += a.get(IN_TOK, 0) + a.get(OUT_TOK, 0)
Check: take one day of traces and compare the number of root tasks with the ticket count in the client’s own system. A large gap means parent–child span linking is wrong, and every number downstream is wrong with it.
Step 4: hours swallowed by review are not hours saved
Fiddler’s formula is simple: hours saved per week, multiplied by the average loaded hourly rate, multiplied by 52 weeks. The condition attached is that only hours genuinely redeployed to other work count. MetaCTO warns along the same lines: do not claim an agent saved 132 hours if the extra review load absorbed all of them.
Do not leave that rule on a slide. Write it into the script, so the counted figure can never exceed the hours the client has confirmed.
from baseline import BASELINE_MIN, REVIEW_MIN, REDEPLOYED_H

def weekly_hours(n_tasks, task_type, week):
    gross = n_tasks * BASELINE_MIN[task_type] / 60
    net = n_tasks * (BASELINE_MIN[task_type] - REVIEW_MIN[task_type]) / 60
    confirmed = REDEPLOYED_H.get((task_type, week), 0.0)  # unconfirmed = 0
    return {"gross": gross, "after_review": net, "counted": min(net, confirmed)}

def annual_value(counted_h, rate):
    return counted_h * rate * 52
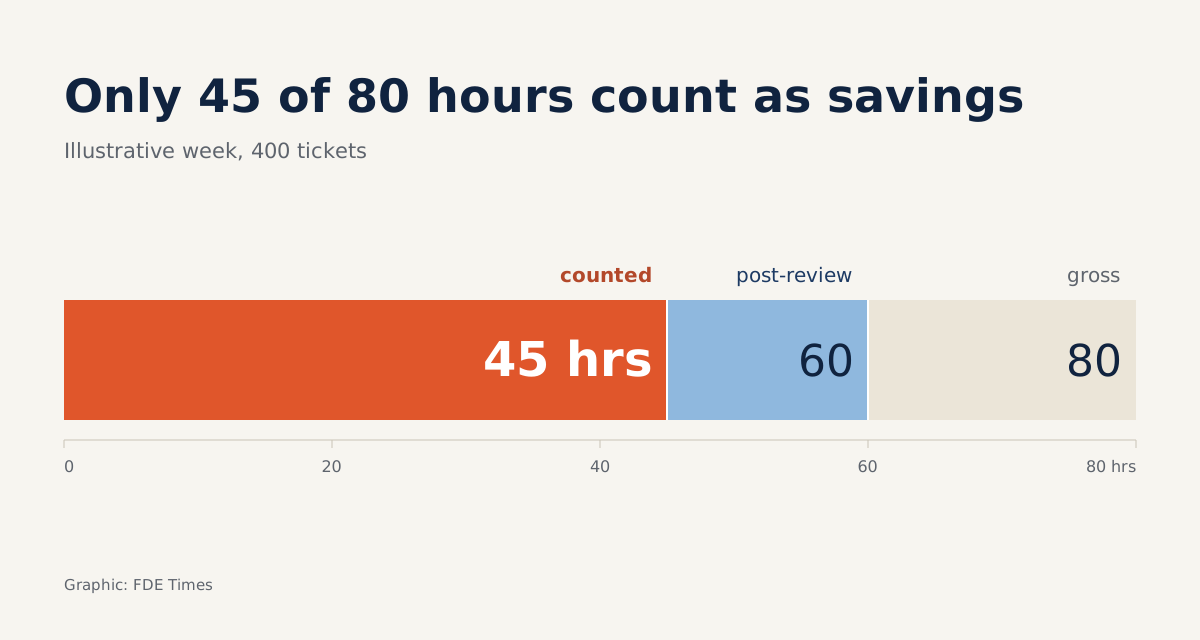
Take a week with illustrative numbers. The agent handles 400 tickets, which is 400 × 12 / 60 = 80 gross hours. Subtract 3 minutes of review per ticket and 400 × 9 / 60 = 60 hours remain.
The client’s manager confirms only 45 hours were reassigned to other work, so counted is 45, not 60. At an assumed rate of 40 currency units an hour, annual_value(45, 40) gives 45 × 40 × 52 = 93,600. For any week without confirmation, the script returns 0 counted hours.
Check: show all three figures on the board: gross hours, hours after review, and hours redeployed to other work. Viewers need to see what you subtracted.
Step 5: put cost next to the savings
Tokens were already summed in step 3. Multiply them by the unit price in the client’s model contract to get cost per task, and display it right beside the labor value. A dashboard with only a benefits column will be challenged in the first meeting.
Add average tool calls per task to the board as an early-warning signal. If it rises while task volume stays flat, open a few traces to see whether the agent is looping, because every wasted step adds tokens.
Step 6: build the per-customer board
If your traces are already in Langfuse, its custom dashboards aggregate over traces, observations, users, sessions and scores. Its Metrics API lets you group by name, model or user ID, at several time granularities. Set user ID to the customer or team code, choose weekly granularity, and you have tasks per week for each customer.
The query below is only a sketch of the shape of the question you send: count traces, group by user ID, bucket by week. Field names are simplified; check them against the Langfuse documentation before running it.
# Metrics API query sketch — simplified field names, not exact syntax
query = {
    "view": "traces",
    "metrics": [{"measure": "count", "aggregation": "count"}],
    "dimensions": [{"field": "userId"}],          # one row per customer
    "timeDimension": {"granularity": "week"},     # one column per week
    "filters": [{"column": "name", "value": "ticket_triage"}],
}
# for each returned row (customer, week, n_tasks):
#   weekly_hours(n_tasks, "ticket_triage", week)
The multiplication by the baseline still runs in your script, because the baseline is manually measured data and does not live in the traces. Langfuse gives you task counts by customer and by week; weekly_hours turns them into counted hours.
Check: add up the task counts for every customer in a week and compare the total with the root-task count from the step 3 script for the same week. The two must match.
Where does the number collapse?
The most common mistake is counting every invoke_agent span without filtering for root tasks, so task counts inflate with the number of sub-agents. The second is using “roughly” figures the client remembers instead of timed measurements. The third is one few people notice: an instrumentation upgrade renames attributes, and the token counter quietly drops to zero without anyone spotting it.
All three undermine the thing finance trusts most, the measured difference. Once one number on the board is found to be wrong, the correct ones beside it lose credibility too.
What does this skill look like at the client?
For an FDE, baseline measurement belongs in the first week of an engagement, not the last. Put it in the deployment plan as a named line item, with an owner on the client side, before the first line of prompt is written. When the quarterly review comes, you bring measured numbers rather than promises.
On the career side, when a job posting mentions observability or proving value to customers, this is the skill to talk about in interviews. On a CV, do not write “built a dashboard.”
Write that you measured a baseline before launch, filtered root tasks from traces and reported hours saved net of review time. A small repo that runs on sample traces, with a baseline file, is more convincing than any line of description.
Every agent produces traces. The figure a client will dare to put in next year’s budget has to be measured with a stopwatch, before the agent ever runs.
Was this article useful?
Thanks for the feedback!
5 sources
- How To Build an AI Agent ROI Calculator That Finance Actually Trusts · 2026-05-12
- AI Agent ROI: What to Measure Before and After Launch · 2026-07-04
- OpenTelemetry GenAI semantic conventions explained (Dash0) · 2026-09-15
- Custom Dashboards - Langfuse Docs
- Custom Metrics API - Langfuse Changelog · 2025-05-12