A single pcap file settles whether the network or the code is at fault
Capture with tcpdump on the client's server, open the file in Wireshark on your own machine, and a few SYN packets will show which side is wrong.
In brief
- Application logs record only what the application thinks happened; a pcap file records what actually crossed the wire.
- A sensible workflow: tcpdump with a narrow filter and -w on the client's machine, then analyze the file in Wireshark on your own.
- The practical obstacle is access: packet capture may need special privileges, so ask for them early.
When a SYN packet goes unanswered, TCP does not resend it straight away. RFC 6298 sets the initial wait before retransmission at one second. That small detail, once it shows up in a pcap file, is often enough to end a meeting that has dragged on all afternoon.
Every time a deployment breaks at a client site, the familiar argument starts again. The client’s infrastructure team says the network is fine, and you are sure your code is correct. Application logs record only what the application thinks happened, while a packet capture records what actually went over the wire.
Two tools, one file format
tcpdump is a command-line packet analyzer that ships alongside libpcap, the packet capture library; both are released under the three-clause BSD license. It suits a client’s Linux servers well, where you often have SSH and no screen.
Wireshark, a project that dates back to 1998, describes itself as a network protocol analyzer that lets you see what is happening on your network at a “microscopic” level. It is released under GPLv2, runs on Windows, macOS, Linux and UNIX, and its user guide lists network troubleshooting as one of its main uses.
The two tools fit together through tcpdump’s -w flag. According to the man page, it writes raw packets to a file instead of parsing and printing them, and Wireshark can open files created by tcpdump. The sensible workflow, then, is to capture on the client’s machine and read on yours.
A timeout case, start to finish
Take a hypothetical example. Your service calls an internal client API at 10.0.0.5, port 8443, and times out every few minutes. You run the following on the machine that hosts the service:
sudo tcpdump -i any -w timeout.pcap 'host 10.0.0.5 and tcp port 8443'The filter is written in pcap-filter syntax and keeps only traffic between the two suspect endpoints. Everything else on the machine is ignored, so the file stays small and the client worries less that you have swept up data from other systems.
The -s flag sets the snaplen, the number of bytes taken from each packet. The current man page gives the default as 262144 bytes, but check it against the tcpdump version on the client’s machine. If the client is concerned about sensitive data, offer to cut the snaplen down to just enough for the headers before they have to ask.
Open timeout.pcap in Wireshark. If the file still contains many connections, type ip.addr == 10.0.0.5 && tcp.port == 8443 into the display filter box. That string looks nothing like the filter given to tcpdump, because the two kinds of filter use separate syntaxes.
Two kinds of result, two courses of action
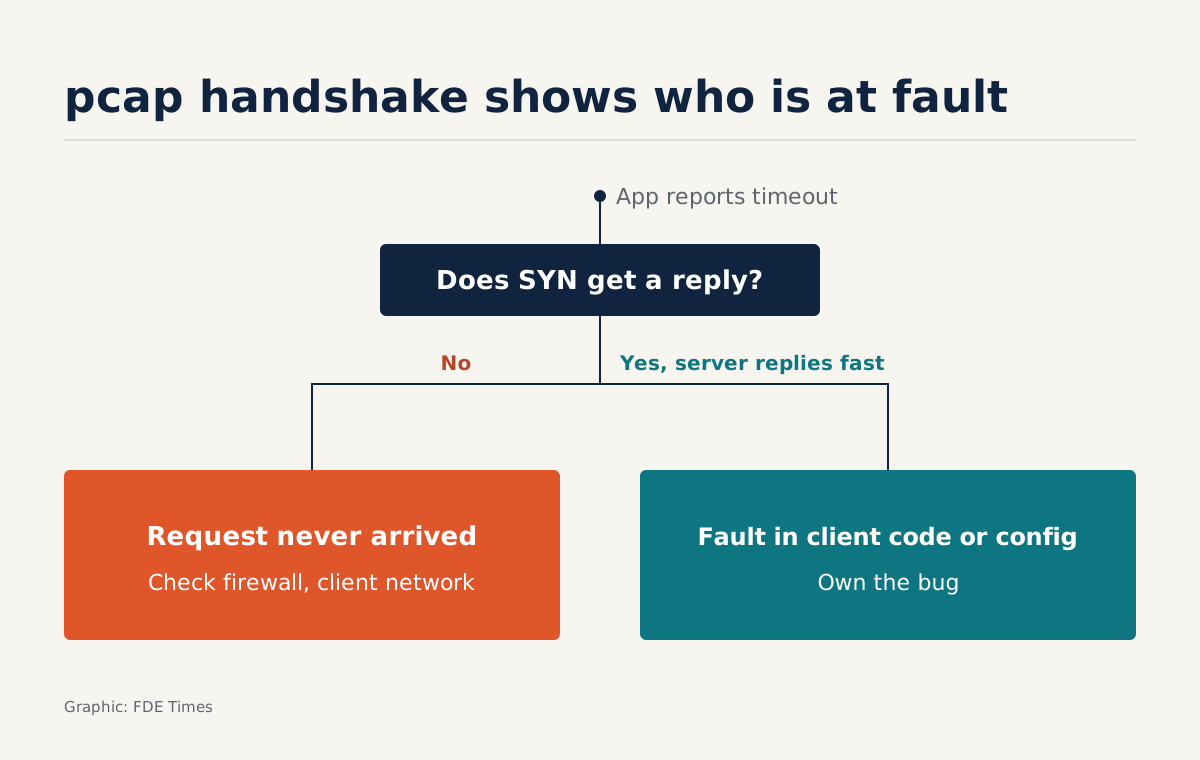
Follow the time column to the moment the application reported a timeout. Suppose that just before it there are three identical SYN packets sent to 10.0.0.5:8443, the first retransmission about one second after the original, and no packet coming back from 10.0.0.5. That one-second gap matches the initial timeout in RFC 6298.
The reading is simple: the request never reached the server. Your machine sent it, the other end stayed silent, so the place to look is the firewall or the network path on the client’s side.
If, on the other hand, the handshake completes and the server replies quickly but the application still reports a timeout, the fault lies in your code or client configuration, and you should own it at once. An FDE who is willing to prove a bug is theirs will be believed the next time they say the problem is the network.
Three common mistakes when capturing at a client site
The first is pasting a Wireshark display filter into tcpdump. Wireshark’s FAQ states plainly that capture filters use a different syntax from display filters. A capture filter decides which packets get recorded, and a dropped packet cannot be recovered, so filter just broadly enough by host and port when capturing and leave the detail to Wireshark.
The second is forgetting about privileges. Wireshark’s FAQ notes that you may need to run from an account with sufficient privileges to capture packets. At a client, that usually means a ticket, an approver and a few days’ wait, so ask in the first week, before anything has gone wrong.
The third is relying on the server’s private key to decrypt TLS. Wireshark’s TLS wiki recommends a key log file via SSLKEYLOGFILE and warns that the RSA private key method does not work with TLS 1.3. A key log unlocks the traffic, so treat it as a secret and agree with the client who holds the file and when it gets deleted.
A small exercise for practice: the pcap-filter man page has syntax for selecting packets by TCP flag, such as 'tcp[tcpflags] & (tcp-rst|tcp-ack) == (tcp-rst|tcp-ack)' to capture only packets with both RST and ACK set. Capture with this filter while connecting to a closed port on your own machine, then compare the result with the case of a SYN that nobody answers.
What to learn first
Start with tcpdump, -w and pcap-filter syntax, because that is the part you must get right on someone else’s machine. Next, read TCP handshakes in Wireshark until you can tell at a glance which step a connection stopped at. Leave TLS decryption for last.
On your CV, do not write a vague “knows Wireshark”. Write a line such as “identified the root cause of a timeout with packet capture, proving the fault lay in the client’s firewall”. A recruiter hiring FDEs who reads that line will see an engineer who knows how to use evidence to defuse an argument.
The next time someone says “there’s nothing wrong with our network”, you do not need to argue. You only need to ask for permission to run tcpdump for ten minutes.
Was this article useful?
Thanks for the feedback!