Your client already runs Superset. Measure your results there
If you define a metric in the right place, the number holds up in every client meeting, and nobody spends the hour asking where it came from.
In brief
- If the client already runs Superset, put your results dashboard there. Do not bring in another BI tool.
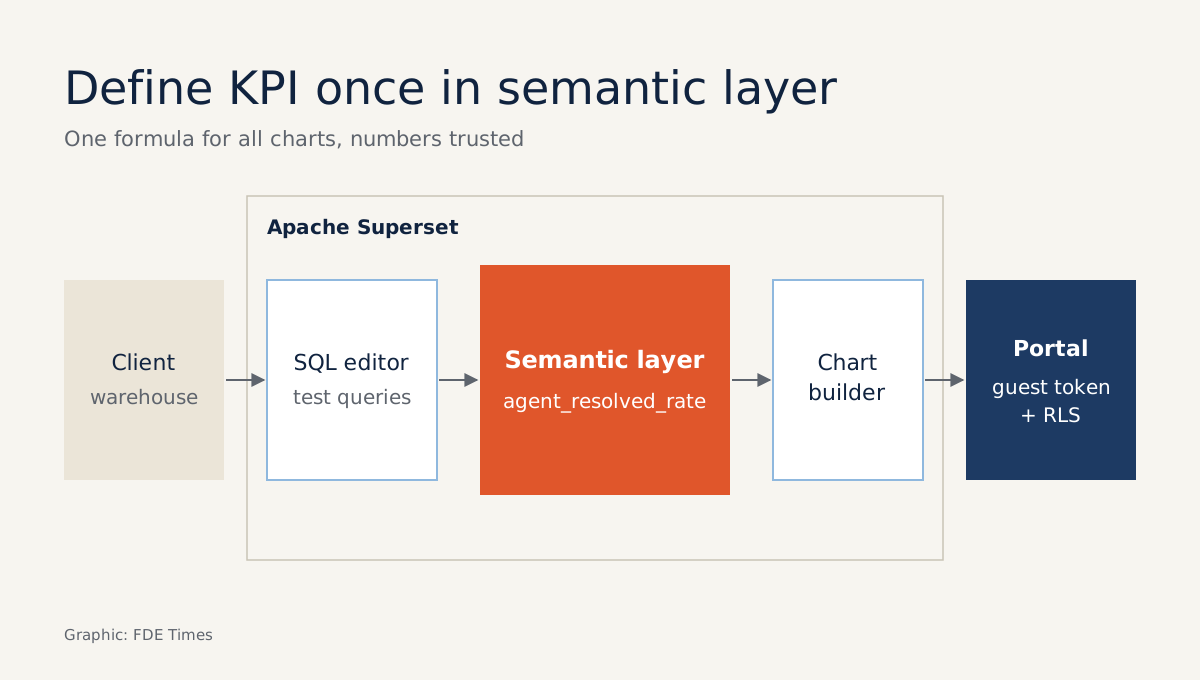
- Define the metric once in the semantic layer and check it in the SQL editor. Only then build no-code charts.
- To put the dashboard in the client's portal, embed it with an iframe and filter data by viewer with a guest token carrying RLS.
If a client already runs Apache Superset, that is where the dashboard measuring your project should live. The project’s README says Superset can query any SQL-speaking datastore or engine, so you can point it straight at the warehouse the client already uses.
Once an agent is in production, the client will want to know how much it is helping. Build a second BI tool just to present your numbers and the audience is likely to start asking where the figures came from rather than discussing the results.
A dashboard that sits next to the reports the client opens every morning starts out with more trust. That is the reason to learn Superset before you walk into a client that already uses it.
Superset is not new, either. According to Preset, it began at an Airbnb hackathon in the summer of 2015, and the Apache Software Foundation made it a Top-Level Project on January 21, 2021. The README now calls it a “modern, enterprise-ready” BI web application, released under the Apache 2.0 license.
What does Superset offer an FDE?
According to the README, Superset has a no-code chart builder so the client’s team can build their own charts, a web-based SQL editor for complex queries, and a “lightweight” semantic layer for defining shared dimensions and metrics. All three match the day-to-day work on a client site.
On data sources, each engine needs a Python DB-API driver and a SQLAlchemy dialect. With those in place, you connect directly to the client’s existing warehouse without copying data anywhere else. The project also offers configurable security roles, a range of authentication options and an API for programmatic customization.
On a client engagement, use those three features in a different order from the one the README lists them in. Check the numbers in the SQL editor first, then lock the formula in the semantic layer, and leave the chart builder for last.
One KPI, from SQL to dashboard
Take a hypothetical case. Your agent triages and resolves support tickets on its own, and the client wants to know the “share of tickets the agent resolves by itself”. The tickets table in the warehouse has a resolved_by column whose value is either agent or human.
Start in the SQL editor: SELECT SUM(CASE WHEN resolved_by = 'agent' THEN 1 ELSE 0 END) * 1.0 / COUNT(*) FROM tickets. If the first week had 1,200 tickets and the agent handled 420 of them, the result should be 0.35, or 35%. Before you trust that number, pull out 10 rows and count them by hand.
Once the formula is right, move it into the semantic layer as a clearly named metric, such as agent_resolution_rate. From then on every chart uses the same definition, whether you build it or the client’s analyst builds it in the no-code interface.
A common problem at this stage: a manager filters out spam tickets, the denominator changes, and two dashboards report two different numbers.
So the first job on site is to sit down with the KPI owner and settle which tickets count toward the denominator. Then encode exactly that in the metric.
Putting the dashboard in the client’s portal
Clients often want their users to see results inside an internal application or portal, without logging in to Superset. The Embedded SDK does this by inserting an iframe containing the Superset page into the host application.
The valuable part is authentication. Viewers of an embedded dashboard are authenticated with a guest token, and the token can carry row-level security rules that filter data according to who holds it. The whole company can then share one dashboard, while the manager of branch A sees only branch A’s tickets.
An easy mistake is to test the embedded dashboard only with your own account, which sees every row, and conclude that RLS is working.
The test to run: issue two guest tokens, one for branch A and one for branch B, and open the same dashboard with each.
Then compare the ticket totals each side sees with a query in the SQL editor filtered by branch.
Design the RLS rules with the client’s security team from the start. A dashboard that leaks another branch’s data can destroy trust faster than a bad KPI.
What Superset will not do for you
Superset works only with SQL data sources that have a DB-API driver and a SQLAlchemy dialect. If your agent’s logs sit in files or in a system that does not speak SQL, you have to get them into the warehouse first. That pipeline is your job.
The project itself calls its semantic layer “lightweight”. Complex business logic, such as removing duplicate tickets or attributing tickets to the right agent version, should therefore be handled in the warehouse and land as clean tables. Superset is then left with computing ratios and drawing charts.
Embedding also needs the client’s application to take part: it must have a place to insert the iframe and a way to issue guest tokens to the right people. Build that work into the rollout plan, and do not promise to have it “embedded in an afternoon”.
What to learn first, and what to put on your CV
Learn in the order the work happens. First comes SQL, solid enough to write a ratio formula and joins that do not multiply rows. Then the semantic layer, then embedding and RLS. The chart builder is the quickest to pick up, so leave it for last.
On your CV and in interviews, be specific, for example: “defined a self-resolution-rate KPI in Superset’s semantic layer and embedded a dashboard with row-level security in the client’s portal”. A line like that shows you understand both the data and the client.
Your project has truly succeeded only when the client’s KPI owner opens the dashboard they know and sees a number calculated exactly the way they agreed.
Was this article useful?
Thanks for the feedback!