k9s reads a client's cluster faster, and deletes by mistake faster
Turn on read-only mode before opening a production cluster, because ctrl-k deletes a resource without asking for confirmation.
In brief
- k9s is a terminal UI that continuously watches a Kubernetes cluster; it runs on Linux, macOS and Windows under the Apache 2.0 licence.
- Colon commands, regex and label filters, Pulses, XRay and live logs make it faster to isolate a fault in an unfamiliar cluster.
- ctrl-k deletes a resource without confirmation, so turn on read-only before touching a client's production cluster.
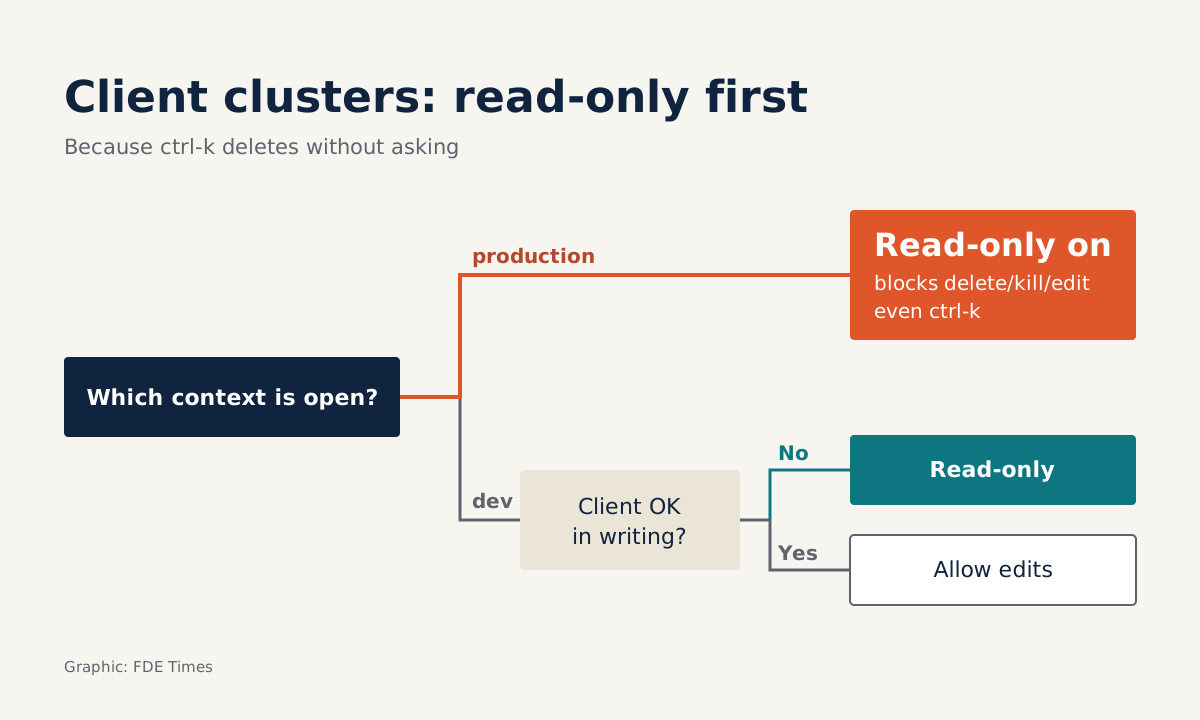
In k9s, a single key combination is enough to delete a resource on a client’s cluster. The official documentation describes ctrl-k as a kill command with no confirmation dialog, equivalent to kubectl delete --now.
The scenario is familiar. You have just SSHed into the client’s bastion host, you do not yet know which namespace runs what, and their team is waiting for you to explain why the new service keeps restarting.
Typing kubectl get for pods, then deployments, then events, and scanning each name is slow and easy to get wrong. k9s shortens that search, but the same speed means you should lock out write access before you start.
What k9s actually is
The k9scli.io homepage defines k9s as a terminal-based UI for working with Kubernetes clusters. The GitHub repository states the aim plainly: to make it easier to navigate, observe and manage applications. The tool continuously watches Kubernetes for changes and offers commands for acting on the resources you are observing.
Fernand Galiana introduced k9s in early 2019 in a post titled “If you K8s, please try K9s…”, built around the idea of a single tool for managing and diagnosing a cluster. It is released under the Apache 2.0 licence and runs on Linux, macOS and Windows. It can be installed via Homebrew, snap, winget, Scoop, Chocolatey, Docker or go install.
For an FDE, the difference lies in that “watching” state. kubectl gives you a snapshot at the moment you type the command. k9s gives you a screen that updates itself, so when a pod changes state while you are talking to the client, you see it immediately without rerunning anything.
Tracing a CrashLoopBackOff pod in prod
Imagine a client with three clusters: dev, staging and prod. The payments service in the payments namespace fails only in prod: the pod starts, dies and starts again, the CrashLoopBackOff state. What follows is a sample diagnostic session, step by step.
Step 1: open the tool safely. Type k9s --readonly. The README lists this flag, and in read-only mode modifying commands such as delete, kill and edit are disabled. From this second on, a stray keystroke can do no harm.
Step 2: pick the right cluster. Type :ctx to see the list of contexts, then switch to prod from inside the tool. The check at this step is simple but often skipped: is the context name on screen really the cluster the client reported as failing?
Step 3: go to the right namespace. Type a colon followed by the resource name, in singular, plural or short form, optionally with a namespace, for example :po payments. The screen updates itself, so you will see the failing pod change state continuously instead of rerunning commands.
Step 4: cut the noise. If the namespace has dozens of pods, filter within the resource view. You can use a regex matching the service name, an inverse regex to exclude healthy pods, a label selector on the application label, or fuzzy find. The goal is to be left with only the pods that keep restarting.
Step 5: understand where the pod sits in the architecture. Open XRay to see the dependency tree: which deployment produces which replica set, and then which pod. If you do not yet have the overall picture, Pulses gives you a cluster overview. The question to ask: is the failure confined to a new replica set, or is every pod in the deployment dying?
Step 6: read the logs. This is where you will spend most of your time. By default k9s fetches the last 100 lines, keeps a 1,000-line buffer, and a sinceSeconds of -1 means following the log live. Look for the last lines before each time the pod dies. If the service logs heavily, raise these values in the configuration file.
By the end of the session you have the cluster, namespace, deployment and relevant log lines in hand, and you have changed nothing on the client’s system.
The risk lies in the convenience itself
A tool that lets you browse quickly also lets you act quickly, and ctrl-k does not ask twice. On a test cluster, a slip costs a few seconds to recreate the resource. On a client’s prod cluster, it can cost you the trust they have just placed in you.
That is why read-only should not be a habit you have to remember on every launch. k9s configuration lets you set read-only globally or per context, and it is off by default. The advice is to turn it on for every production context from day one, and to enable write access only on a dev context once the client has agreed in writing.
To edit resources from inside k9s, the installation page requires you to set the EDITOR or KUBE_EDITOR environment variable. Before setting them on a client’s machine, ask whether you should be editing by hand at all. Changes usually belong in the client’s manifests or pipeline, where they leave a trail.
One more piece of advice: treat k9s as an accelerator for kubectl, not a substitute for understanding Kubernetes. If you cannot yet read events or work out why a pod is in CrashLoopBackOff, k9s will only help you get confused faster.
Learn kubectl first, then speed up
The sensible order is to master kubectl for pods, deployments, logs and contexts, then move to k9s. Once comfortable, learn three things: colon commands together with :ctx, label filters, and XRay for reading the architecture of an unfamiliar cluster.
The README also mentions Popeye, a cluster health-scanning tool, worth trying when you need a list of issues to discuss with the client.
On a CV or in an FDE interview, do not just write “knows k9s”. Describe a specific incident: you entered a prod cluster with read-only access, isolated the failing pod by label, read the live logs and proposed a fix through the client’s process. Hiring managers want to see that you can diagnose quickly while staying safe.
A client’s cluster is not a practice ground. Turn on --readonly before opening k9s, and only then start hunting for the fault.
Was this article useful?
Thanks for the feedback!