Datadog for FDEs: tracing a slow request to the right log line on a customer's system
If a log line is missing its trace_id field, the investigation stalls in the middle of a customer meeting. The check that catches the problem takes five minutes.

In brief
- Every request sent to an instrumented application becomes a trace. The trace's flame graph shows where the time goes.
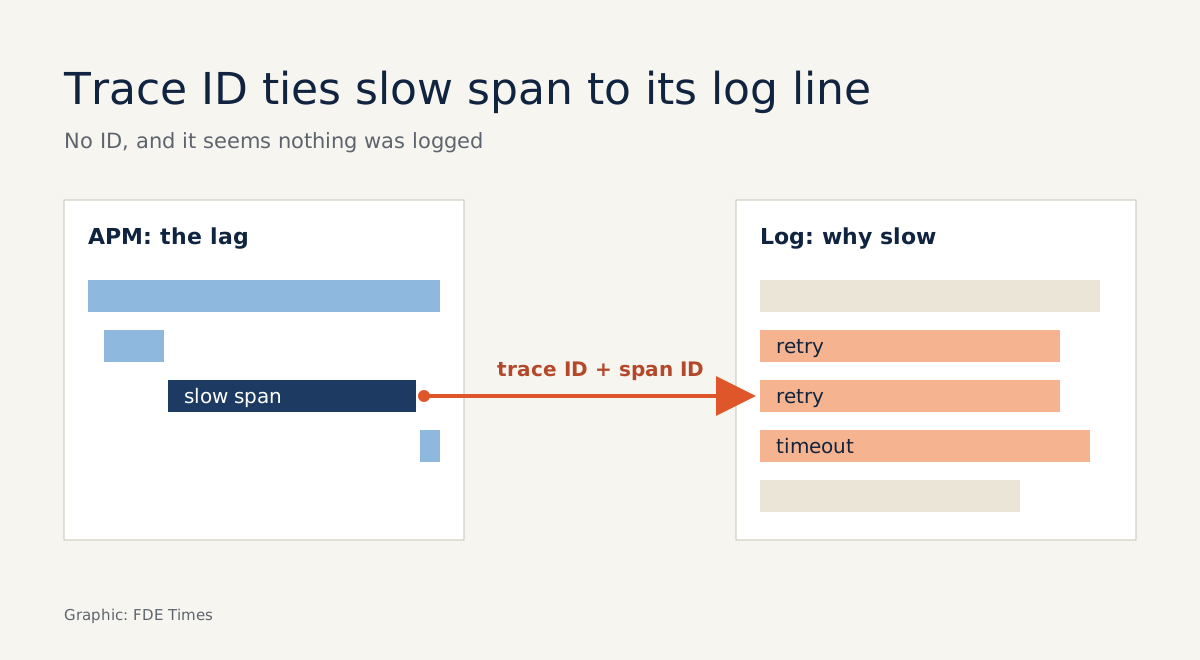
- Datadog links traces to logs by injecting the trace ID and span ID into the logs. A log without a trace ID will not appear under its trace.
- At Datadog, the FDE role is a management job that advises customers through complex deployment cycles. At Dash0, the FDE implements OpenTelemetry hands-on at enterprise customers.
Datadog’s own FDE job listing does not ask you to debug inside a customer’s Datadog. The role, “Forward Deployed Engineering Manager - Datadog for Startups”, calls for a trusted advisor to customers through complex deployment cycles. The person must be willing to travel extensively and will manage a team of SWEs and TSEs who are seconded to the team in rotations.
When Dash0 was hiring an FDE for EMEA, it described work that was far more hands-on: working directly with enterprise customers to deploy and configure OpenTelemetry instrumentation in their environments. That listing has since closed, but it shows where the real work sits: making observability work correctly on the customer’s system.
For most FDEs, the real test comes once the customer is already running Datadog. A request is slow, everyone in the meeting turns to you, and you have to get from the trace to the log line that explains it. What follows is that workflow, plus a five-minute check that many people skip.
Every request leaves a trace
Datadog’s APM tutorial starts simply. Each time you run a curl command against the sample application, a new trace is sent to Datadog and can be opened in the Traces view. Select a trace and you see its details, including a flame graph. According to Datadog’s documentation, the flame graph is where you identify performance bottlenecks.
A trace tells you where the time went. To know why, you need logs. Datadog connects the two by injecting the trace ID and span ID into logs as attributes. The log panel for a trace offers four filters: trace_id, host, container_id and pod_name. Only the trace_id filter narrows the view to the log lines that carry that request’s ID.
A slow request nobody can explain
Imagine you have just shipped an integration into a customer’s system. On day three, the customer reports that some requests going through your service take a long time to return. Their team suspects your component, and you have no evidence to the contrary.
You open Traces, pick a slow trace for that endpoint and read the flame graph. Suppose most of the time is spent in a call to one of the customer’s internal services, not in your code. You switch on the trace_id filter in the log panel to see what that request logged, and the panel is empty.
This is where many people jump to the conclusion that the request wrote no logs at all. Usually the logs exist; Datadog simply does not know which trace they belong to.
The five-minute check before the meeting
Send a sample request yourself, the way Datadog’s tutorial uses curl, then open the log line it produced. There is one question: does this line carry a trace ID? Datadog’s troubleshooting documentation is blunt: if a log has no trace ID, it will not appear under the trace.
Imagine the customer service’s log line looks like this, with the ID stored under a custom field name:
{"level":"warn","msg":"upstream timeout, retry 3/3","traceId":"<id>"}In that case, Datadog’s documentation tells you to extract the ID and remap it to trace_id, the attribute Datadog reserves for this purpose.
If you are the one instrumenting from scratch, get the names right from the start. The OpenTelemetry specification, a vendor-neutral standard, says JSON logs and other non-OTLP formats should use the fields trace_id and span_id, written in lowercase hex.
The slowest span is not always the culprit
Once the logs are linked, you may see a string of retries and timeout messages. Keep a clear head here: the customer’s internal service may be slow precisely because your requests are sending it too many retries, in which case the fault comes back to your side.
The flame graph gives you the durations; the logs give you the story behind them. Bring both into the meeting and the conversation shifts from “whose fault is it” to “where do we fix it”.
What to learn first, and what to put on your CV
Start with the sample application in the APM tutorial and practise reading flame graphs until you can point to the suspicious span in seconds. Next, link traces to logs, including the remap step for when field names do not follow the standard. Then learn the OpenTelemetry conventions, because they are the core of the FDE role Dash0 was hiring for, and they travel with you to every customer.
When you read job listings, look at what the day-to-day work actually is. Advising on deployments, as at Datadog, is very different from installing instrumentation yourself, as at Dash0. Factor in heavy travel requirements too.
Datadog’s secondment model also suggests a way to try the role. If you are a SWE or TSE at a company with a similar rotation programme, asking for a rotation lets you try FDE work without changing jobs.
On your CV, do not just write “proficient in Datadog”. Describe a specific case: which system you instrumented, how you linked traces to logs, and how much you cut the time to find bugs, if you ever measured it.
However good the observability tooling, a trace still stops at the boundary between two teams. The person who can open the log line right at that boundary is the one customers want to keep.
Was this article useful?
Thanks for the feedback!