Prompt caching in practice: order the prompt to hit the cache, then measure cost and latency
A single timestamp in the wrong place is enough to break the whole cache. This guide shows how to reorder a prompt and prove the savings with the API's own usage figures.

In brief
- The cache covers the prompt in the order tools → system → messages; change one layer near the front and every layer after it loses its cache.
- Put the breakpoint on the last block that is identical across requests; a single character out of place means a miss.
- Measure with cache_read_input_tokens, cache_creation_input_tokens and input_tokens, not by feel.
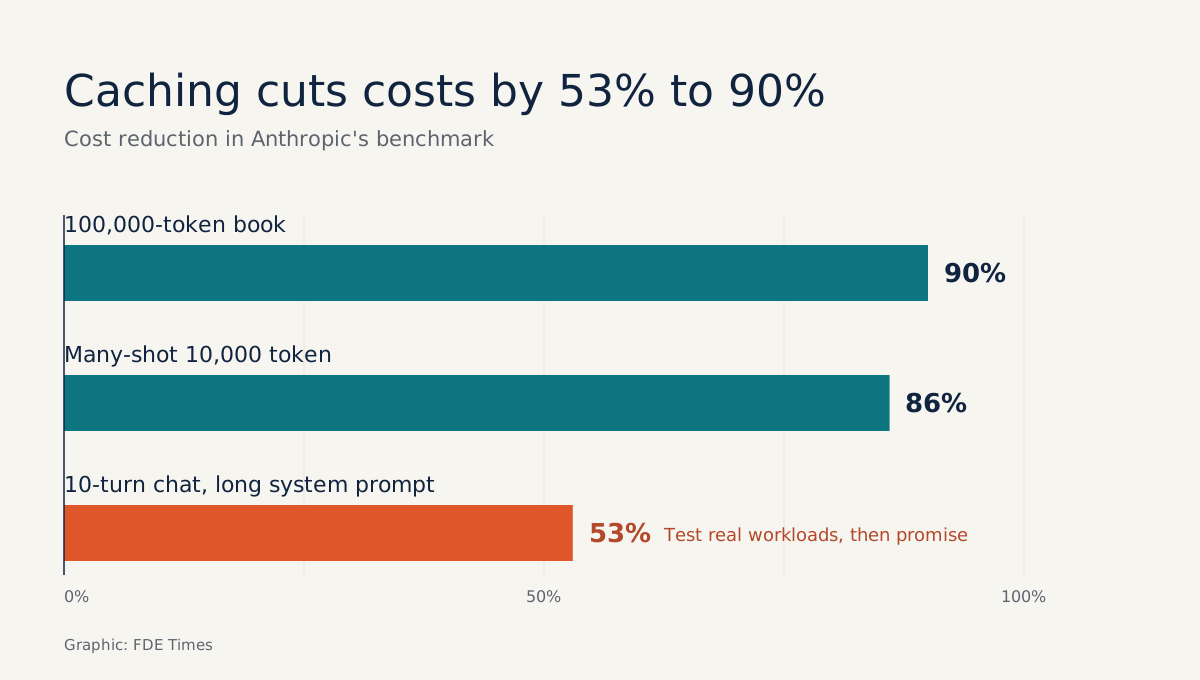
With a prompt containing a 100,000-token book, Anthropic measured time to first token falling from 11.5 seconds to 2.4 seconds, and cost falling by 90%. It did not need a new model to get there. It simply had the system read back the part of the prompt it had already processed instead of processing it again from scratch.
The catch is that the cache only hits when the beginning of the prompt is identical. Picture a client system that puts the date and time or the user’s name on the first line of the system prompt. Caching may be switched on, but every request will miss.
This guide walks through six steps: measuring a baseline, reordering the prompt, placing the breakpoint, checking for hits and converting the result into money. At the end you will have a before-and-after table to hand to the client, which is exactly what an FDE needs to bring to the review meeting.
What will you build, and what do you need?
We will write a small Python script that answers questions over a long, unchanging policy document. The script runs in two modes, with and without caching, and records the latency and token counts of each request. You need an Anthropic API key, the Python SDK and a sufficiently long text file, such as an internal procedure or product documentation.
The code below has been trimmed for readability. Check the model name and the exact cache_control syntax against Anthropic’s prompt caching documentation before running it for real.
Step 1: measure a baseline before touching anything
Without a “before” figure there is no “after” story. Wrap the API call and record the timing and the usage fields.
import time, anthropic
client = anthropic.Anthropic()
MODEL = "..."   # fill in the model you use, taken from Anthropic's documentation
DOC = open("policy.txt").read()   # the static part, unchanged between requests

def build_system(cached):
    system = [{"type": "text", "text": "You are a policy lookup assistant."},
              {"type": "text", "text": DOC}]
    if cached:
        system[-1]["cache_control"] = {"type": "ephemeral"}  # simplified
    return system

def ask(question, cached):
    t0 = time.perf_counter()
    r = client.messages.create(model=MODEL, max_tokens=300,
        system=build_system(cached),
        messages=[{"role": "user", "content": question}])
    u = r.usage
    return (time.perf_counter() - t0, u.input_tokens,
            u.cache_creation_input_tokens, u.cache_read_input_tokens)
The ask function measures total response time, including the time spent generating output. Anthropic’s benchmark, however, measures time to first token, so to compare directly with its figures you need a streaming variant like the one below (simplified; check the syntax against the SDK documentation).
def ask_ttft(question, cached):
    t0 = time.perf_counter()
    ttft = None   # initialise first, in case no text comes back
    with client.messages.stream(model=MODEL, max_tokens=300,
            system=build_system(cached),
            messages=[{"role": "user", "content": question}]) as s:
        for _ in s.text_stream:
            ttft = time.perf_counter() - t0   # the first token has arrived
            break
        u = s.get_final_message().usage
    if ttft is None:   # response had no text: record total time and flag it
        ttft = time.perf_counter() - t0
    return (ttft, u.input_tokens,
            u.cache_creation_input_tokens, u.cache_read_input_tokens)
After this step, run both ask(q, cached=False) and ask_ttft(q, cached=False) on 10 questions and save the results. That gives you total time, time to first token and token counts for the “before” column. In later steps, just switch to cached=True and run the same two functions again.
Step 2: which order gets you cache hits?
According to Anthropic’s documentation, the cache covers the whole prompt in a fixed order, tools, then system, then messages, up to and including the block marked with cache_control. A change at any layer invalidates that layer and every layer after it. Edit a tool definition, even just by swapping the order of two tools, and system and messages lose their cache too.
So there is only one ordering rule: stable content first, dynamic content last. OpenAI gives similar advice, namely to put stable instructions and shared reference material at the start. If you switch providers, the habit still serves you.
Picture a system prompt that opens with “Today is 25/10/2026, user: Lan”. Every user, every day, produces a new prefix. Move that line into the user message, after the static documents.
Step 3: where should the breakpoint go?
Anthropic recommends placing the breakpoint on the last block that stays identical across requests. Each request may use up to 4 breakpoints. In the script above that block is DOC, because the question changes constantly and sits in messages after it.
For multi-turn conversations, one suggestion follows from these two rules: earlier turns stay the same between requests, so they are also candidates for a second breakpoint, within the limit of 4. This is an application of the rules rather than a ready-made recipe, so verify it with the usage figures in step 4 before trusting that it works.
Step 4: how do you know a request hit the cache?
Run the same question twice in a row with cached=True. The first request should show cache_creation_input_tokens greater than 0 and cache_read_input_tokens equal to 0. On the second request, with the same prefix, cache_read_input_tokens should be greater than 0.
If the second run still shows only creation tokens, the prefix has changed somewhere. A single character out of place is enough for the cache to create a new entry. Compare the two prompts with a diff, not by eye.
Total input for each request equals cache_read_input_tokens + cache_creation_input_tokens + input_tokens. Divide the read figure by that total and you have the hit rate, which is the number worth tracking on a dashboard.
Step 5: warm the cache before running in parallel
A common trap in batch processing is firing 50 requests at once and finding that every one of them writes to the cache. A cache entry only exists once the first response starts coming back, so parallel requests sent at the same moment all miss. The fix is to send one request first, wait for it to start responding, and only then go parallel.
Watch the TTL as well. By default the cache lives for 5 minutes and is refreshed free of charge on every hit. If your traffic is sparser than that, you can choose a 1-hour TTL, but you pay more for writes.
Step 6: how do you turn this into money?
According to Anthropic’s pricing, writing to the cache with a 5-minute TTL costs 1.25 times the base input price, a 1-hour TTL costs 2 times, and reading from the cache costs only 0.1 times. Some newer models have an even lower read price. The function below computes cost in units of “base input price”, excluding output tokens.
def cost_units(inp, write, read, write_rate=1.25):
    # write_rate=2.0 for a 1-hour TTL; the 0.1 read price may be lower on newer models
    return inp * 1.0 + write * write_rate + read * 0.1
Take a hypothetical example: a 20,000-token static document, 10 questions within 5 minutes, ignoring the short questions themselves. Without caching, the cost is 10 × 20,000 = 200,000 units.
With caching, the first call writes 20,000 × 1.25 = 25,000 and the next nine read 9 × 20,000 × 0.1 = 18,000, for a total of 43,000 units, a reduction of about 78.5%.
The example also shows when caching does not pay. If each prefix is used exactly once, you pay 1.25 times without a single read-back, a 25% loss.
What should your results look like?
The improvement depends on the workload. Anthropic’s benchmark recorded about a 75% drop in latency and 53% in cost for a 10-turn conversation with a long system prompt. A 10,000-token many-shot prompt saw latency fall 31% and cost 86%. Do not promise a client 90% before measuring on their own workload.
| Metric | Before | After |
|---|---|---|
| Time to first token (seconds) | ask_ttft(..., cached=False) |
ask_ttft(..., cached=True) |
| Hit rate | 0% | read / total input |
| Input cost (units) | cost_units |
cost_units |
How is OpenAI different?
OpenAI caches automatically; you do not need to set breakpoints. To check for hits, read the cached_tokens field. It counts only billed read tokens, not tokens charged as writes.
The prompt_cache_key parameter only affects request routing. It does not pin a request to a machine, nor does it guarantee a cache hit. So the way to verify is still the number in the usage data.
Which mistakes break the cache most often?
The most common is putting dynamic content such as the date and time, user name or an ID before the static content, so the prefix changes with every request.
A close second is editing or reordering tool definitions: because tools comes first, a change there costs system and messages their cache as well.
The third is putting cache_control on a block that still changes, rather than on the last block that stays identical.
The remaining three are operational. Firing a parallel batch before the cache is warm means every request misses. Traffic sparser than the 5-minute TTL lets the cache expire between calls, and a prefix used only once means paying the write fee with no read-back.
With OpenAI, the usual mistake is believing that setting prompt_cache_key is enough. Whatever the provider, there is only one way to catch all six of these errors: check the usage fields after every change.
How does this skill show up with clients?
On the client side, it usually starts with a line like “the API bill doubled this month” or “the chatbot is too slow”. A good FDE does not swap the model straight away. They open the prompt, find what is breaking the prefix, reorder it, and put the before-and-after table above in front of the client.
When reading job descriptions, look for phrases such as “LLM cost optimization” or “latency”. On your CV, include measured figures, for example how far the hit rate rose and by what percentage input cost fell, along with how you measured them. Interviewers trust three usage fields more than adjectives.
The next time you open a long prompt, read the first line first. If it changes with every request, you have found the first thing to fix.
Was this article useful?
Thanks for the feedback!