The agent dashboard is green and the customer is still unhappy
Completion rate, tool errors, step count and escalations can be measured from week one and turn vague complaints into a list of fixes.
In brief
- Infrastructure latency and error rate only tell you the machine is running, not that the task is done; the outcome layer is the main quality signal.
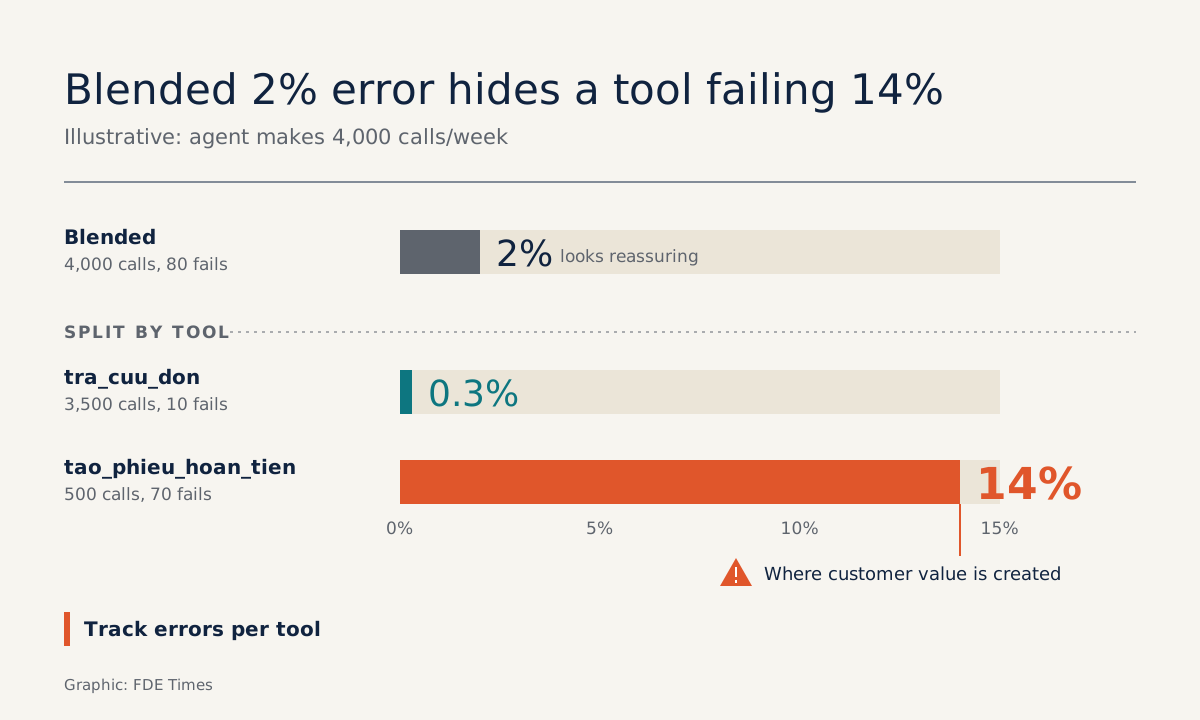
- Split tool error rates by tool: an overall 2% can hide a single tool failing at 14%.
- A step count far above normal signals an agent stuck in a loop; read the escalation rate together with the reasons for escalation.
The refund-handling agent has been live at the customer’s site for two weeks. The dashboard is entirely green: latency is stable, the servers report no errors, throughput is steady. Yet on Monday morning the head of customer support calls you: “My staff are redoing half the tickets the agent creates.”
Almost every FDE will face this situation sooner or later. The system has not crashed; it is quietly doing the wrong work. What you are tracking is whether the machine runs. What the customer is asking is whether the job gets done.
This guide shows how to answer the second question with four numbers: completion rate, tool errors, step count and escalation rate. All four can be measured from the first week of a deployment, and they turn vague complaints into a list of things to fix.
A healthy machine does not mean the work is done
New Relic divides agent monitoring into three views. The operational layer covers latency, errors, throughput and dependency health, which is what infrastructure dashboards already show. The behavioural layer covers prompts, model responses, tool calls, retries, token usage and handoffs. The outcome layer covers task completion rate, the number of times a human has to correct the work, and escalation rate.
The refund agent above scores perfectly on the first layer and fails on the third. Blaxel treats task completion rate as the primary quality signal and puts it bluntly: when that rate drops from 85% to 60%, you know something has broken, even if the infrastructure looks normal.
The aggregate number is a familiar trap
Anyone who has studied machine learning has met the accuracy trap. Google’s ML Crash Course gives the example: on imbalanced data, a model that always predicts “negative” can still reach 99% accuracy while being useless. Google’s advice is to avoid accuracy for imbalanced data and to choose additional metrics.
An aggregate tool error rate suffers from exactly the same problem, because tool calls are also unevenly spread across tools. Imagine that in one week the agent calls tools 4,000 times: the tra_cuu_don (order lookup) tool accounts for 3,500 calls and fails 10 times, while the tao_phieu_hoan_tien (create refund ticket) tool has only 500 calls but fails 70 times. Combined, that is 80 errors in 4,000 calls, or 2%, which sounds reassuring.
Split it out and the picture changes. The lookup tool fails about 0.3% of the time, while the ticket-creation tool fails 14%, and that is precisely the step that delivers value to the customer. This is why Blaxel recommends tracking tool-call success rates for each tool in the system, rather than looking only at the overall figure.
One JSON record per run
To split figures by tool, by task type and by escalation reason, you need structured data from the moment you log it. Cloud Logging calls this structured logging: the payload is a JSON object stored in the jsonPayload field. The benefit is that you can query by individual JSON paths and index specific fields.
For the refund agent, a record for each run might look like this:
{
  "run_id": "r-8812",
  "task_type": "hoan_tien",
  "outcome": "escalated",
  "escalation_reason": "tool_error",
  "steps": 7,
  "tool_calls": [
    {"tool": "tra_cuu_don", "ok": true, "latency_ms": 320},
    {"tool": "tao_phieu_hoan_tien", "ok": false, "error": "timeout"}
  ],
  "tokens": 5400
}
This record alone gives you the data for all four numbers. outcome yields completion rate and escalation rate, tool_calls[].ok yields errors per tool, and steps yields step count. In Cloud Logging, a query such as jsonPayload.outcome="escalated" filters out every run handed to a human, which you can then group by escalation_reason.
If the customer already has an observability stack, do not force yet another tool on them. OpenTelemetry is an open protocol for sending logs, metrics and traces from production systems, so you are not locked into a single vendor.
OpenLLMetry is an open-source project that extends OpenTelemetry for LLM applications, giving visibility into prompts and vector databases, and exports traces to whatever observability stack the customer already uses.
Reading the four numbers for the same week
Continuing the hypothetical example: that week there were 1,000 runs. 700 ended with status completed, 200 were escalated to a human, and 100 were abandoned after hitting the step limit. Completion rate is 70%; escalation rate is 20%.
The 20% figure says nothing on its own about whether things are good or bad; the reason for escalation is what matters. If most of those 200 runs have escalation_reason set to tool_error, the problem lies in the ticket-creation tool, and fixing the timeout will lift the completion rate.
If the reason is “request exceeds the refund limit”, the agent is doing exactly what it should, and an agent that never escalates would be the real cause for concern.
The 100 runs that hit the step limit are a separate signal. Blaxel describes an infinite loop as an agent that keeps retrying the same approach without getting any closer to the goal.
If most runs finish in around 4 steps but one group climbs to 15, open the traces for that group: the agent is very likely calling the ticket-creation tool again after every timeout.
At this point three numbers are pointing to the same place. The 14% tool error rate produces most of the escalations and the long retry loops, and both drag down the completion rate. When you call the head of customer support back, you no longer have to say “we are investigating”; you have a cause and a plan to fix it.
Five steps to build it from scratch
The first step happens with the customer, not in code. The rest can serve as a checklist:
- Agree with the customer on what “completed” means. For refunds, it might mean the ticket is created correctly and staff do not have to correct it, since New Relic places the number of human corrections in the outcome layer. Write this definition down; otherwise each side will read it differently.
- Fix the JSON schema for a run, as in the example above, with a fixed list of values for
outcomeandescalation_reason. - Log at the end of every run, including failed runs, because the runs that go missing are usually the broken ones.
- Build a four-panel dashboard, split by
task_typeand by tool. - Set alert thresholds for completion rate and for maximum step count.
Once things are stable, add a number that speaks the language of whoever signs the contract. Blaxel suggests cost per successful outcome, a metric that links infrastructure cost to business results. It is easy to compute because the record already holds both tokens and outcome.
Common mistakes
The most common mistake is logging only the operational layer because the tools are already there, and assuming that counts as monitoring the agent. The second is reporting an aggregate tool error rate, as in the 2% versus 14% calculation above. The third is logging free-text strings, so that when you need to count by field you end up writing regexes while the customer waits.
There is a subtler mistake too: treating the escalation rate as something to push down at any cost. Push too hard and the agent starts handling cases it should never touch; the escalation rate looks better while the number of staff corrections goes up.
How to show this skill when job hunting
When reading job descriptions for FDE or AI engineer roles, look for the words observability, OpenTelemetry, tracing or evaluation in production. When you see them, have a concrete story ready for the interview about how you measured an agent.
On a CV, a line such as “designed a log schema for an agent, split error rates by tool, identified the tool behind most escalations” carries far more weight than “experience with LLMs”.
The next time a customer calls to say the agent is getting things wrong, your first question should not be “where is the bug?” but “which field in the records for those runs will tell me?”
Was this article useful?
Thanks for the feedback!
6 sources
- Classification: Accuracy, recall, precision, and related metrics (Google ML Crash Course) · 2026-01-12
- Structured logging (Cloud Logging documentation) · 2026-10-06
- Introducing OpenLLMetry — Extending OpenTelemetry to LLMs · 2023-10
- What is OpenLLMetry? - traceloop
- A Production Monitoring Blueprint for AI Agents (New Relic)
- AI observability: How to monitor production agents safely (Blaxel) · 2026-01-28