The system works but nobody uses it: how FDEs measure and drive adoption
The dashboard is green and the pipeline runs without errors, yet the client's users keep going back to their old spreadsheets. There is no bug to fix here, and the FDE still has to find out why.

In brief
- Installation does not create value. Value arrives only when users change how they work, and they do not change just because a new system exists.
- Counting logins makes it easy to believe everything is fine. Count a meaningful action instead, divided by the total number of intended users.
- If users keep their spreadsheets, it is usually because the spreadsheet holds context the system lacks. Sit next to them to find that context.
The final demo went smoothly. The demand forecasting model produced accurate results, the pipeline ran without errors and the dashboard was green throughout. Three weeks later, you open the logs and find that most planners are still exporting data to their old spreadsheets and doing the calculations themselves.
For an FDE, this is the most frustrating kind of failure, because there is no bug to fix. Umbrex observes that enterprise software rarely creates value simply by being installed. However accurate the model, if planners do not use it, the value it delivers to the client is zero.
That makes adoption part of the deliverable, not something you hand to someone else after you leave. Tryolabs gives its “Drive adoption” step two concrete outputs: a baseline of adoption metrics and a trained team of internal champions. What follows shows how to produce both.
What does the old spreadsheet do that your system does not?
Go back to the planner above. The spreadsheet does not exist because users are stubborn. Umbrex gives exactly this example: a supply planner clings to a spreadsheet because the ERP system lacks context, and users do not change their workflow just because a new system has arrived.
The spreadsheet holds something the official system does not. Your job therefore has two parts. The first is to measure honestly so you know where you stand. The second is to find the missing piece between the solution and the user’s daily work.
Logging in is not using
The most common mistake is counting logins. Basedash stresses that a user counts as “active” only when they perform a meaningful action; logging in does not count.
The denominator matters just as much.
These four metrics are enough for a baseline on most FDE projects:
| Metric | How to calculate | Question it answers |
|---|---|---|
| Adoption rate | Users who performed the meaningful action / total intended users | Of those who need to use it, how many actually do? |
| WAU | Users who performed the meaningful action in the last 7 days | How many use it regularly, on a weekly working rhythm? |
| Activation rate | Users who completed the action that unlocks core value / users who started using it | Do new users reach the “aha moment”? |
| Time-to-value | Time from first use to first value received | How long do they wait before the solution proves useful? |
Basedash argues that for most B2B products, WAU is the most sensible primary engagement metric. The reason is straightforward: much enterprise work runs on a weekly cycle, so measuring daily can mislead you.
Basedash also gives reference thresholds for DAU/MAU: above 0.25 means the average user opens the product at least once every four days, which counts as good for B2B. Below 0.10 is weak.
An example: 40 planners, only 6 real users
Picture a distributor with 40 planners expected to use your forecasting tool. You define the meaningful action as approving or editing a forecast recommendation and then pushing it to a purchase order. A query on the events table looks like this:
-- WAU based on meaningful actions, with intended users as the denominator
SELECT
  COUNT(DISTINCT e.user_id)                AS wau_meaningful,
  (SELECT COUNT(*) FROM intended_users)    AS intended,
  ROUND(COUNT(DISTINCT e.user_id) * 1.0
        / (SELECT COUNT(*) FROM intended_users), 3) AS adoption_rate
FROM events e
JOIN intended_users u ON u.user_id = e.user_id
WHERE e.event_type IN ('forecast_approved', 'forecast_edited_and_pushed')
  AND e.created_at >= CURRENT_DATE - INTERVAL '7 days';
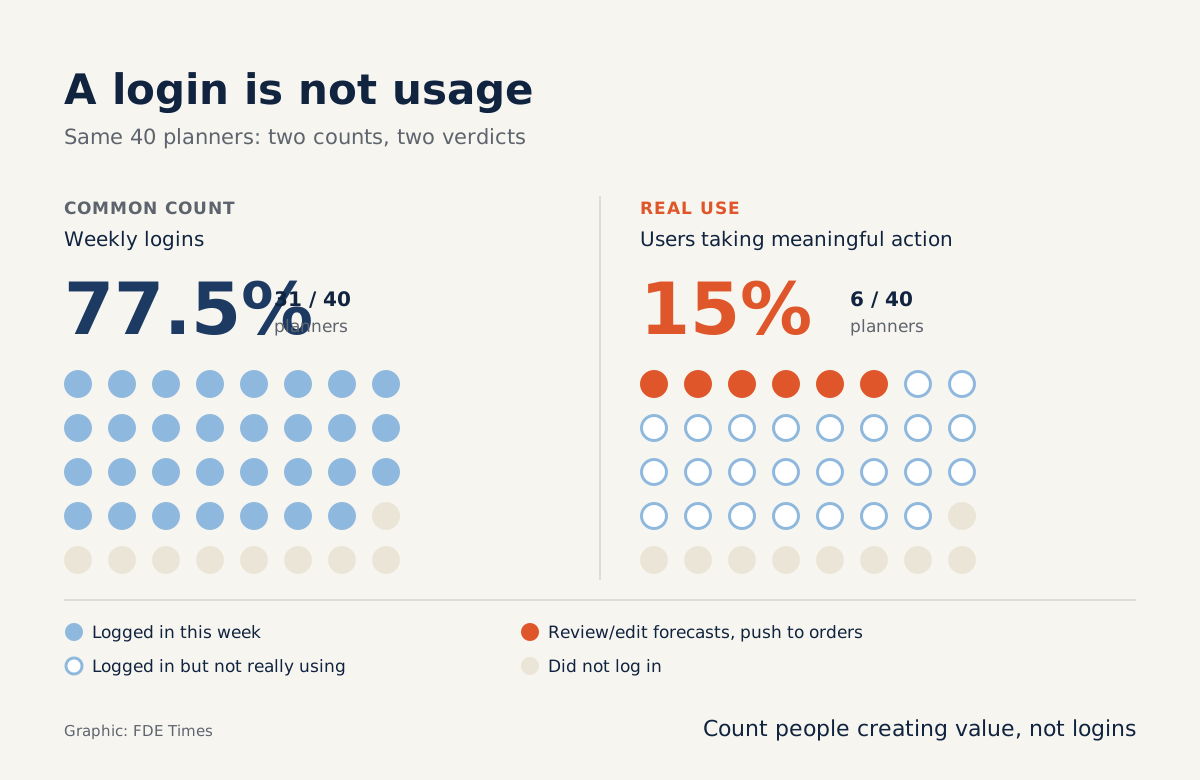
Suppose 31 people logged in last week. Reported by logins, the figure is 31/40, or 77.5%, enough to keep the whole department happy. But the query above returns only 6 people. The real adoption rate is 6/40 = 15%.
Next, calculate DAU/MAU using the same definition. Suppose that on average 2 people perform the meaningful action each day, and 16 people performed it at least once during the month.
The ratio is 2/16 = 0.125, between the weak threshold of 0.10 and the good threshold of 0.25. Taken together, the numbers say this: many people have tried the tool, but few use it in place of their old way of working.
The numbers tell you the tool is stuck, but not where. Invisible Technologies describes days when FDEs do nothing but sit beside users to understand how decisions are actually made.
Suppose that while sitting with one planner, you see her copying the promotions calendar from the marketing team’s emails into her spreadsheet, because your model does not know which weeks have promotions. The spreadsheet holds precisely the context the system is missing.
The fix now involves both data and workflow. You add the promotions calendar as a feature, and you show recommendations directly on the screen planners already use to create orders, rather than making them open another tab.
Invisible Technologies calls this designing workflows that reflect how users actually behave. You then pick two of the 6 genuine users and train them as champions, because colleagues trust colleagues more than they trust the vendor’s people.
Do it yourself in five steps
- Agree with the client’s project sponsor on who the intended users are, and record that list as a data table.
- Write a one-sentence definition of the meaningful action, then add event tracking for exactly that action before go-live. No events, no baseline.
- In the first week after go-live, run the queries for adoption rate, WAU, activation rate and time-to-value. Send the figures to the client together with the definitions, so nobody misreads them.
- Sit beside at least three people: a heavy user, someone who tried the tool and gave up, and someone who has never opened it.
- Fix exactly what is missing, train the champions, then measure again using the same definition to compare against the baseline.
Mistakes that make you think everything is fine
The first mistake is dividing by the number of accounts instead of the number of intended users. If only 10 of the 40 people have been given accounts, a 100% rate across those 10 still hides 30 people who were never reached. The second is using DAU for a tool that only needs opening once a week, then wrongly concluding that users are not interested.
The third is treating every adoption problem as a training problem. If the spreadsheet holds context the system lacks, another training session will not solve anything. The last is leaving the project without champions: adoption will then decline as soon as you are gone.
If you are preparing to move into an FDE role, look for phrases such as “drive adoption” or “user enablement” in job descriptions.
On your CV, instead of writing “deployed system X”, state how you raised the number of people performing a specific action each week, from what to what, out of the total intended.
A line like that shows you understand that installation is not the end of the job.
A project is not finished when the model runs. It is finished when the planner no longer needs to open the old spreadsheet.
Was this article useful?
Thanks for the feedback!
5 sources
- Forward Deployed Engineers | Tryolabs
- When the FDE Model Creates Value (The Forward Deployed Engineer Playbook, Umbrex)
- What is Forward Deployed Engineering? A guide to the role, benefits, and real enterprise examples · 2025-11-21
- B2B SaaS product metrics: DAU, WAU, MAU, activation, and engagement scoring | Basedash
- 20 Must-Track Product & User Adoption Metrics (2026) · 2026-01-12