Your first minutes on a client's server start with ssh -J
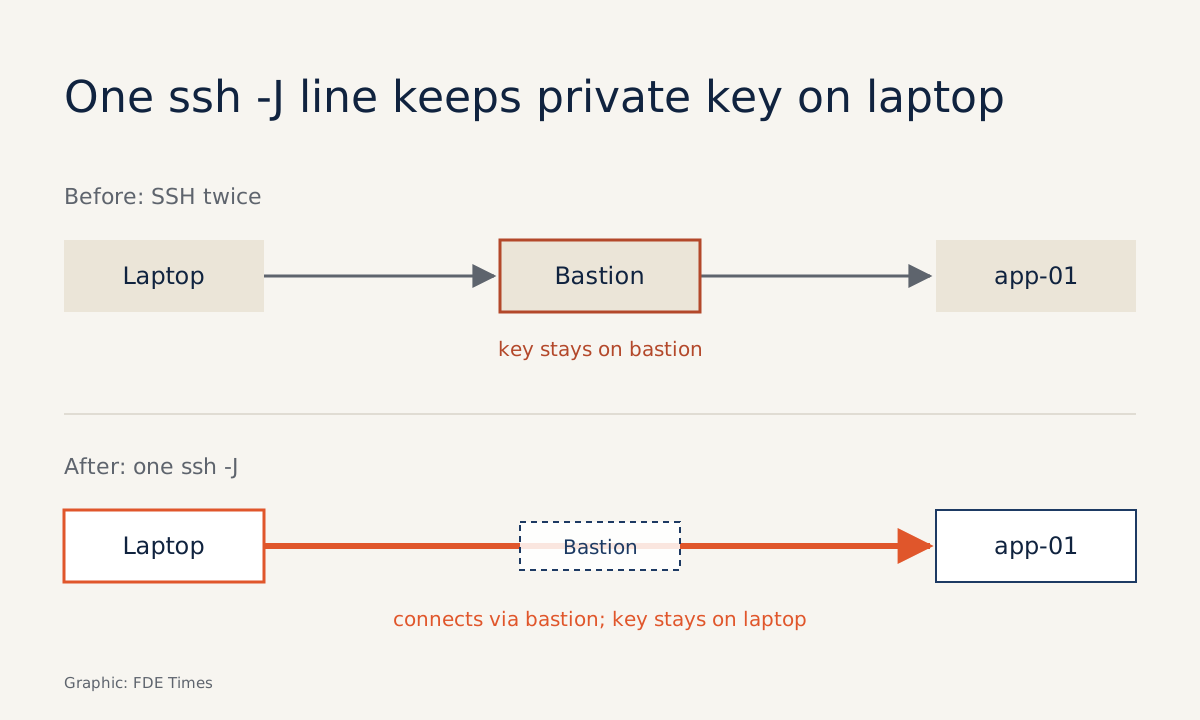
Hopping through the bastion from your laptop keeps your private key off the client's machine, and a short script records the server's state before you start guessing.
In brief
- ssh -J is shorthand for ProxyJump: one command line, through as many bastions as you need, with each hop separated by a comma.
- The list of ten commands to run first in an investigation, written by Brendan Gregg and Netflix's performance team in 2015, includes uptime, dmesg | tail and vmstat 1.
- A diagnostic script should be readable above all, because simple scripts tend to grow into complex ones.
On a client site, the first thing you type is often not code. It is usually an ssh line with a -J flag, followed by uptime. In those few minutes, the client decides whether you have their system under control.
Corporate servers are rarely exposed directly to the internet. You have to go through a bastion, and you usually can’t install anything on the target machine. To work as an FDE you need to be fluent in two things: getting onto the target cleanly, and recording the machine’s state before you start guessing.
This guide walks you through building a realistic setup on your own laptop: reach a target through a bastion, run a few built-in commands, then wrap them in a short script that brings the results back. You need a machine with the OpenSSH client and two Linux machines you can SSH into, either virtual machines or cloud instances.
The first machine plays the bastion; the second is “the client’s server”.
Step 1: one ssh -J line instead of two logins
Newcomers often SSH into the bastion, then SSH from there into the target. That works, but it makes it easy to leave your private key sitting on the bastion, which is the client’s machine. According to the OpenSSH ssh(1) manual, the -J flag is shorthand for the ProxyJump directive, and it is the standard way to go through a jump host.
ssh -J [email protected] [email protected]You run one command, and the connection to the target is made from your laptop, tunnelled through the bastion. Once in, run hostname to confirm you are on app-01 and not on the bastion. The mistake sounds silly, but running the wrong command on a client’s bastion is not a small matter.
Some clients use two layers of bastions, for example one for the office network and one for the production zone. The manual lets you declare several hops, separated by commas:
ssh -J user@bastion-outer,user@bastion-inner [email protected]Step 2: put the route in ~/.ssh/config
Typing that whole chain every time is tedious and error-prone. Because -J is just shorthand for ProxyJump, you can write the route into your config file once and reuse it. The example below is simplified to the minimum lines:
Host client-bastion
    HostName bastion.example
    User user

Host client-app01
    HostName app-01.internal
    User user
    ProxyJump client-bastion
From now on, ssh client-app01 is enough. Run hostname again to check. Prefix host names by client: when you work on two projects at once, a name like app01 can easily land you in the wrong environment.
At some clients you will find older configs using ProxyCommand instead of ProxyJump. This relies on the -W flag, which the manual describes as forwarding the client’s stdin and stdout to a host and port over the secure channel. You don’t need to write this yourself, but you need to be able to read it. A simplified example:
Host client-app01-old
    HostName app-01.internal
    ProxyCommand ssh -W app-01.internal:22 client-bastion
Step 3: the first three commands, and what to compare them with
Once you are in, it is tempting to open the application logs straight away. Hold back for a moment. Brendan Gregg’s Linux performance page links to “Linux Performance Analysis in 60,000 Milliseconds”, which he wrote with Netflix’s performance engineering team in 2015. It sets out ten commands to use first in an investigation.
The Thomas-Krenn wiki reproduces the list. Three of the commands are available on almost every Linux machine:
uptime
dmesg | tail
vmstat 1
Raw output tells you nothing without something to compare it against. So before you go on site, run these three commands on your own machine, once when it is idle and once under heavy load, and save both as baselines.
On the client’s machine, the concrete task is to put the output next to your two baselines and mark the differences. Are the numbers from uptime closer to the idle run or the loaded one? Does dmesg | tail show any lines your baseline doesn’t? Which vmstat column deviates most? Those three questions are enough to tell you where to dig next.
Interpreting each column is the next lesson. To read vmstat properly, see the dedicated vmstat article linked from the Thomas-Krenn wiki, and read the full list of ten commands in Gregg’s original post.
Step 4: a diagnostic script should be readable in 10 seconds
After a few rounds, you will want to put the commands in a file. The Shell Scripting Tutorial treats clear, readable layout as the most important criterion. A script written in a hurry on site is often opened by someone else, sometimes the client’s own operations engineer standing next to you.
#!/bin/bash
# diagnose.sh: record the machine's state, using only built-in commands

echo "== Host: $(hostname)"

echo "== uptime"
uptime

echo "== dmesg | tail"
dmesg | tail

echo "== vmstat (5 samples, one per second)"
vmstat 1 5
(The comment and labels are in Vietnamese: the script records the machine’s state using only built-in commands, Host means “machine”, and the last label reads “5 samples, one per second”.)
The last line uses vmstat 1 5 so the script stops after five samples instead of running forever. This is a simplified version; check it against man vmstat on the machine you are actually using. Some systems may not let ordinary users read dmesg. If that happens, record the error message rather than asking for root on your own initiative.
Run the script without copying the file onto the client’s machine (simplified syntax):
cat diagnose.sh | ssh client-app01 'bash -s' > results-app01.txtThe results land on your laptop, ready to send to teammates or paste into a ticket. Check the == Host: line in the file to confirm the output came from the right host.
A common mistake: letting the script grow too big
The Shell Scripting Tutorial warns that simple scripts tend to become complex ones. On a client site this happens fast. Today you add a loop over ten hosts, tomorrow some output parsing, and next week you have 300 lines of Bash that nobody dares touch.
Once the script starts to branch, stop and ask: is this a one-off diagnostic tool, or a product the client will have to maintain? If it is a product, discuss it with the client before leaving it on their machine.
Two other mistakes are common. One is copying your private key onto the bastion for convenience; with -J, there is no need. The other is forgetting to check hostname, then spending half an hour diagnosing the wrong machine.
How the skill shows on a client site
Picture a client reporting that their API has been slow since the morning. You don’t yet have access to their monitoring, only an SSH account through a bastion. About a minute after logging in, you have an output file that clearly names the host, ready to compare against a normal baseline and share with teammates.
That earns far more trust than “let me look at the code”.
For structured practice, two resources are worth using. Linux Journey, created by Cindy Quach in 2015 and now run by LabEx, is free and requires no sign-up. Its intermediate and networking sections cover logging and troubleshooting.
LabEx’s Linux for Noobs course has 37 labs on a real Linux terminal, 19 guided labs and 18 self-directed challenges, covering SSH, logs, processes and Bash scripting.
When you read an FDE job description that mentions working in client environments or with restricted access, it usually means you will be going through bastions like this. It is worth asking for specifics in the interview.
On your CV, rather than a generic “proficient in Linux”, describe a specific incident: how you got onto the machine, what you ran first, and how long it took to find the cause.
Clients remember an FDE for the first minutes on their machine, when you knew which host you were on and came back with evidence, more than for any code written afterwards.
Was this article useful?
Thanks for the feedback!