Hands-on: four layers of alerts for client data that arrives late, loses rows, changes schema or stops arriving
A client's order file can arrive late, get cut in half or have its columns renamed while the pipeline still shows green. This guide shows how to catch the problem before the client does.
In brief
- Client data usually breaks in three ways: it arrives late, it is missing rows, or its schema changes. Each needs its own check, plus one more layer for when the job does not run at all.
- Measure freshness by load time, not event time, and set separate thresholds according to each feed's SLA.
- Alert only on symptoms the client will see, and build in slack so that a few minutes' delay does not wake anyone at midnight.
A green pipeline does not mean the data is right. A job can run successfully on yesterday’s file, on a file with half its rows, or on a file in which the client has just renamed the amount column to total_amount. The dashboard still shows numbers. They are simply wrong.
For an FDE, this is the kind of incident that destroys trust fastest. The client does not care how many services your system has. What they remember is the first time they spotted bad numbers before you did. So if you are handed a pipeline that ingests client data, this is something to build early.
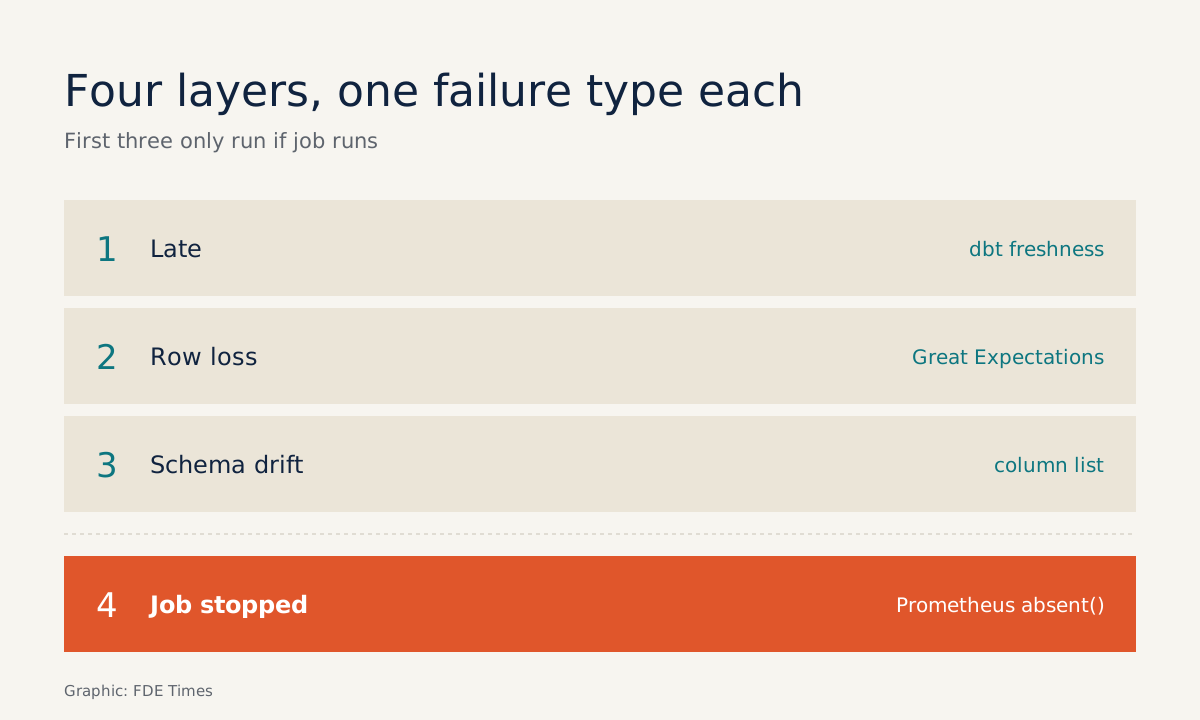
This guide works through a hypothetical case. A retail chain loads an orders table into the warehouse every night and sends its product catalogue every week. You will build three layers of checks for three failure modes: late arrival, missing rows and schema changes. Then you will add a fourth layer as a safety net for when the job does not run at all.
What do you need?
You need a dbt project with sources declared, a Python environment with Great Expectations installed, and a monitoring tool. That tool might be Prometheus, Datadog or Sentry, depending on what the client uses. You do not need all three. On a real engagement, use whichever tool the client’s operations team already watches.
The most important prerequisite is in the data: every table must have a column recording when each row was loaded, such as _etl_loaded_at. If that column does not exist, the first job is to add it to the ingest step.
Step 1: dbt freshness catches late data
The dbt documentation describes the freshness config as the place to declare how fresh source data needs to be. The two main thresholds are warn_after, the maximum age of the newest record before dbt warns, and error_after, the point at which dbt reports an error. Each threshold needs both a count and a period.
sources:
  - name: retail_client
    loaded_at_field: _etl_loaded_at
    freshness:
      warn_after: {count: 12, period: hour}
      error_after: {count: 24, period: hour}
    tables:
      - name: orders
        freshness:  # stricter for orders
          warn_after: {count: 6, period: hour}
          error_after: {count: 12, period: hour}
          filter: _etl_loaded_at >= current_date - 3
      - name: product_catalog
        freshness: null
This snippet is simplified. Where the freshness key sits can vary between dbt versions, and the date syntax in filter depends on the warehouse. Three details in this config are worth noting.
Per-table thresholds. dbt lets you set thresholds per table and switch the check off. That is why orders is checked more strictly, while product_catalog, which only updates weekly, is skipped.
filter keeps the check cheap. This key adds a WHERE clause to the freshness query, so dbt does not have to scan the whole of a large table.
loaded_at_field points at load time. This is the detail most often missed. dbt needs this column to know when data last arrived, in cases where the adapter does not provide that metadata, and you should point it at load time rather than the time the order was placed.
Suppose the client backfills orders from three days ago. If you use event time, the data looks three days stale; if you use load time, you see when the file actually arrived.
Check: run dbt source freshness, then temporarily lower warn_after to 1 hour to make sure you can see the warning state.
Step 2: an unusual row count often means a truncated file
Freshness only tells you whether data arrived. It does not tell you whether all of it arrived. If an export file is cut off midway, the newest record still has a recent timestamp and the freshness check still passes.
Great Expectations has an expectation that checks whether a table’s row count falls within a range, inclusive of both bounds. min_value can be set on its own, so a lower bound is all you need to detect missing rows.
import great_expectations as gx

row_check = gx.expectations.ExpectTableRowCountToBeBetween(
    min_value=30000,
    max_value=None,
)
This omits the batch connection and validation run. Try the arithmetic with hypothetical data. If orders has ranged from 38,000 to 45,000 rows over the last 14 nights, a floor of 30,000 still leaves room for a quiet night. But if tonight’s file has only 19,000 rows because it was cut in half, the check fails.
A fixed threshold struggles when volume varies by day of the week, for instance when weekends run at double the weekday level. Datadog has anomaly monitors that learn from historical data to detect unusual behaviour, which suits this kind of data better.
Datadog also has monitors for freshness, row count and column-level metrics across many warehouses, which means all three failure modes can be watched from one tool.
Check: run the expectation against a copy of the table with half its rows deleted. The check must fail.
Step 3: schema changes need an agreed column list
The two checks above cover only freshness and row count. For schema, the simplest approach is to write a small check yourself. The snippet below is an illustration, not a complete solution: store the column list agreed with the client, then compare it with the actual columns on each load.
EXPECTED = {"order_id", "store_id", "amount", "created_at", "_etl_loaded_at"}

def schema_diff(actual_columns):
    actual = set(actual_columns)
    return {"missing": EXPECTED - actual, "new": actual - EXPECTED}
A missing column should be treated as an error. A new column should only raise a warning, since the client has most likely added information rather than broken anything. If the client uses Datadog, you can turn this check into a custom SQL monitor, a monitor type listed in Datadog’s documentation.
Check: rename a column on a test table. missing must contain the old name and new must contain the new one.
Step 4: a safety net for when the job does not run
All three steps above depend on the job running in order to produce a result. If the cron dies, no check reports an error, simply because no check is executed.
Prometheus collects metrics by pulling them and uses a multi-dimensional data model in which each time series is identified by a metric name and key/value pairs. The pipeline can export a metric recording the time of its most recent successful load.
The absent() function works counter-intuitively: while the series still has data, it returns nothing; only when the series has disappeared does it return a result. An alert based on absent() therefore fires only when the feed has stopped reporting entirely.
- alert: OrdersFeedStale
  expr: time() - pipeline_last_success_timestamp_seconds{feed="orders"} > 6 * 3600
  for: 30m
- alert: OrdersFeedMissing
  expr: absent(pipeline_last_success_timestamp_seconds{feed="orders"})
This is a trimmed version, without routing labels or annotations. If the client does not use Prometheus, Sentry Cron Monitoring can monitor any scheduled job, including an ingest job pulling client data.
A common mistake: too many alerts
Prometheus’s guidance on alerting advises keeping alerts as few as possible and alerting only on symptoms tied to what end users actually experience.
The same documentation recommends building slack into thresholds so that small fluctuations do not trigger alerts. The for: 30m and the gap between warn_after and error_after in the examples above are there for that reason.
Two other mistakes are also very common. The first is applying the same threshold to every table, so that a weekly table turns red every day until the whole team mutes the notifications.
The second is sending alerts to a channel nobody owns. Every alert should name the person responsible and include a line saying what to do first.
On a real engagement, this starts with a question
The hardest part is not the YAML. It is asking the client: “How late can the orders file be before it starts causing you problems?” Their answer is your error_after. Setting thresholds this way shows you are doing customer discovery, not just configuring tools.
When reading a job description for an FDE or a client-facing data engineer, look for phrases such as “data quality”, “observability” or “customer SLAs”. On your CV, write in terms of outcomes.
For example: “Built freshness, row count and schema checks for 6 client feeds, catching truncated files before the morning report went out.” The numbers in a sentence like this need to be real figures from your own project.
On your first day with a new client, do not try to build all four layers at once. Start with freshness on the most important feed: it is the cheapest check, and it tells you about a problem before the client has to phone you.
Was this article useful?
Thanks for the feedback!