A/B testing AI features at the client: check SRM before you report a number
A strong offline scorecard won't convince a client. A clean, long enough experiment with guardrails is what proves an AI feature actually works.
In brief
- Passing offline validation does not prove a model creates value on the client's real data. An A/B test does.
- LLM output variance adds to the variance in user behaviour, so you need more traffic and should run for 3-4 weeks.
- If the group split deviates from the design, fix the instrumentation first. Don't read the results.
Picture this: the client has just watched a demo of your AI feature and nodded along. Two weeks later, their head of operations asks bluntly: “Do you have numbers that show it helps?” Accuracy on a test set doesn’t answer that question. Only a controlled experiment on real users does.
Offline validation tells you whether a model generalises. But generalising on a held-out dataset says nothing about the impact on the client’s real workflows and users.
For a Forward Deployed Engineer, that is the gap between “the model is good” and “the client renews the contract”. This guide shows how to build a minimal but technically sound A/B test on your laptop, then take it on site.
What will you build?
Take a hypothetical case: the client is an e-commerce company, and you have deployed an LLM feature that suggests replies to customer service agents.
The treatment group sees suggestions; the control group works as before. You need three things: a stable assignment function, logs with enough information, and a data quality check before you read the results.
Requirements: Python 3 and the standard library (hashlib, math), plus permission to write logs in the client’s system. The code below is a stripped-down version for learning. In production, you would put these pieces into whatever experimentation platform the client already uses.
Step 1: Choose metrics before writing a line of code
Split your metrics into three tiers. The primary metric measures behaviour close to the feature, such as the share of suggestions agents actually use. The business metric sits further away, for example ticket handling time. The last tier is guardrails: things that must not get worse.
Expectations for the business tier tend to run too high. Downstream metrics are the least sensitive, so detecting a meaningful lift on them takes a large sample and a long run.
With a low-traffic client, agree from the start that the primary metric decides the outcome, and the business metric is only monitored.
Guardrails are what many people forget with AI features. A Milvus document gives an example: if Model B triggers the PII detector 10% more often than Model A, that is a clear signal to review the training data. The rate of safety filter blocks and the PII detection rate should be measured in parallel in both groups.
Check: you have a one-page document listing each metric by name and formula, signed off by the client’s owner.
Step 2: Assign by hash, not by random draw per request
The same user must always land in the same group. If an agent sees suggestions today and not tomorrow, you are measuring their confusion, not the feature’s effect.
import hashlib

EXPERIMENT = "reply-suggestion-v1"

def assign(user_id: str) -> str:
    key = f"{EXPERIMENT}:{user_id}".encode()
    bucket = int(hashlib.sha256(key).hexdigest(), 16) % 100
    return "treatment" if bucket < 50 else "control"
Including the experiment name in the key gives each experiment an independent split. Check: run the function on 10,000 fake user_ids and count both groups. The split should be close to 50/50, and calling it again with the same ID must return the same result.
Step 3: Pin the model version and log it
Your treatment does not stand still. LLM providers update models continually, usually without any commitment that versions will hold for the length of your experiment. If the model changes midway, the first and second halves of the experiment are really measuring two different features.
MODEL_VERSION = "model-name-with-specific-version"  # don't use an alias that points to the latest version

def log_exposure(user_id, variant, ts):
    return {
        "experiment": EXPERIMENT,
        "user_id": user_id,
        "variant": variant,
        "model_version": MODEL_VERSION if variant == "treatment" else None,
        "ts": ts,
    }
(The placeholder stands for a specific, versioned model name; the comment says not to use an alias that points to the latest release.)
Don’t assume setting temperature to 0 solves the problem: it does not remove the non-determinism of LLM output. So, beyond pinning the version, write model_version to every log row. If something changes midway, you can still split the data by version for analysis.
Check: query the logs and count the distinct model_version values in the treatment group. The answer should be one.
Step 4: Estimate traffic up front, then run long enough
An LLM feature is harder to measure than a button that changes colour. Variance in LLM output stacks on top of variance in user behaviour, pushing up both the standard error and the minimum detectable effect, so the experiment needs more traffic.
Time is also a trap. A two-week window is often not enough to tell a real lift from a novelty effect, so plan for 3-4 weeks. At a client, say this in the kickoff meeting, because nobody wants to hear “we need two more weeks” at the last minute.
Check: plot the primary metric by week for each group. If the gap between groups gradually narrows, you are watching the novelty effect fade.
Step 5: Check SRM before looking at results
Before opening the results table, check that the two groups match the designed ratio. Sample Ratio Mismatch (SRM) occurs when the observed number of users in each group deviates from the planned allocation.
import math

def srm_pvalue(n_a, n_b, ratio_a=0.5):
    total = n_a + n_b
    exp_a, exp_b = total * ratio_a, total * (1 - ratio_a)
    chi2 = (n_a - exp_a) ** 2 / exp_a + (n_b - exp_b) ** 2 / exp_b
    return math.erfc(math.sqrt(chi2 / 2))  # chi-square with 1 degree of freedom

print(srm_pvalue(5200, 4800))
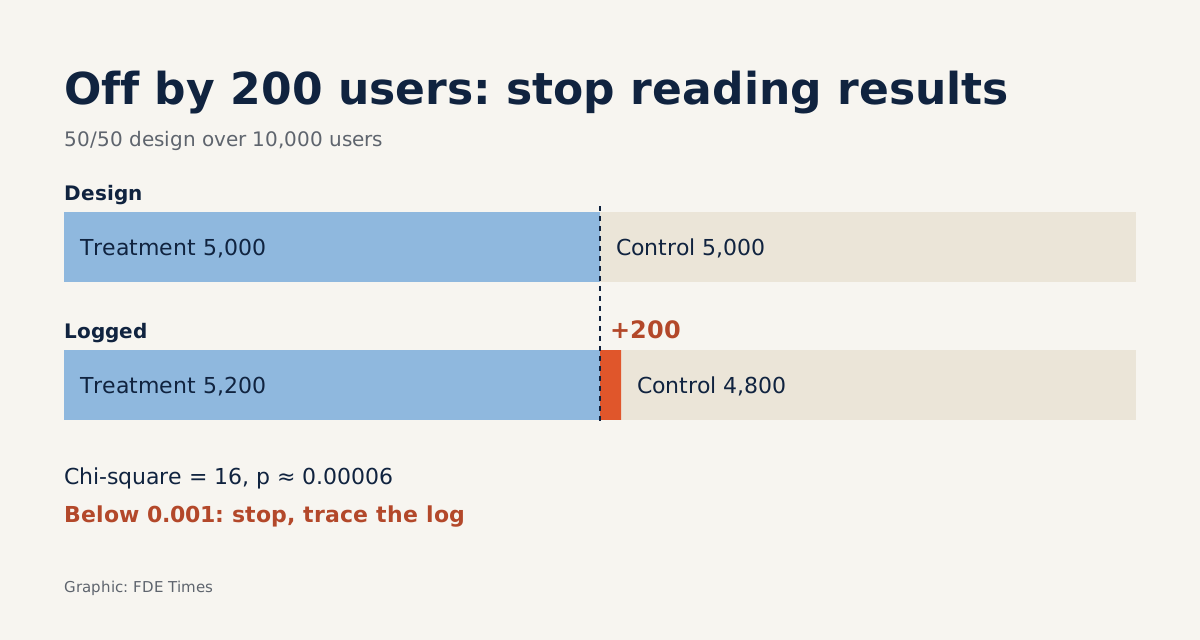
Try a hypothetical: a 50/50 design across 10,000 users, but the logs record 5,200 in treatment and 4,800 in control. Each group is 200 off the expected 5,000, the chi-square statistic is 16, and the p-value is about 0.00006. A gap like that is almost certainly not down to chance. (The comment in the code notes this is a chi-square test with one degree of freedom.)
Authors from Microsoft Research, in a KDD 2019 paper, compare SRM to a fever: a single symptom that can stem from many different kinds of data quality bugs.
Perhaps treatment-group logs are lost when the LLM call times out, or bots land in only one group. SRM does not go away if you wait longer or add more users. The fix lies in the instrumentation, not in reweighting after the data is in.
Check: set a strict threshold in advance, such as 0.001. If the SRM p-value falls below 0.001 (like 0.00006 in the example above), stop reading results and trace the logging path for the under-counted group. A strict threshold keeps you from raising false alarms when you run this check every day.
What are the most common mistakes?
The most common mistake is reporting after a few days because the numbers “look good”, just as the novelty effect peaks. The second is assigning by request rather than by user. The third is logging exposure only in the treatment branch, which creates exactly the SRM you will then have to untangle.
Also, don’t use the business metric as the win-or-lose criterion when the client’s traffic is small. You will get a “not statistically significant” result, and the client will hear “the feature doesn’t work”.
How does this skill show up at the client and on your CV?
At the client, the first job is not writing the assign function but sitting down with the owner to agree on the primary metric, the guardrails and the 3-4 week run. Logging and the SRM check come after. The final report should open with the line “SRM: pass”, and only then present the lift.
When reading FDE job descriptions, look for whether the role calls for measuring impact or running experiments with clients; if it does, put this skill at the top of your CV. A strong bullet point is specific: user-level assignment, pinned model version, PII guardrail, and an SRM bug detected and fixed.
That last detail shows an interviewer you have actually run experiments, not just read about them.
A demo gets you a pilot contract. To get a renewal, you need an experiment that the client’s own data team can audit without finding a flaw.
Was this article useful?
Thanks for the feedback!
5 sources
- What is Machine Learning? | IBM · 2025-08-18
- A/B Testing AI Features When the Treatment Is Non-Deterministic · 2026-04-19
- Diagnosing Sample Ratio Mismatch in Online Controlled Experiments: A Taxonomy and Rules of Thumb for Practitioners · 2019-07
- What is a Sample Ratio Mismatch? · 2026-07-03
- What role do guardrails play in A/B testing LLM applications?