The best-looking vLLM benchmark number is usually the wrong one
Measure TTFT, ITL and throughput with vllm bench serve at the load your customer actually sees, put their SLO into --goodput, and hand the infrastructure team a report they can rerun themselves.

In brief
- --request-rate defaults to inf, and without --max-concurrency there is no cap on concurrent requests, so a default run is a maximum-throughput test.
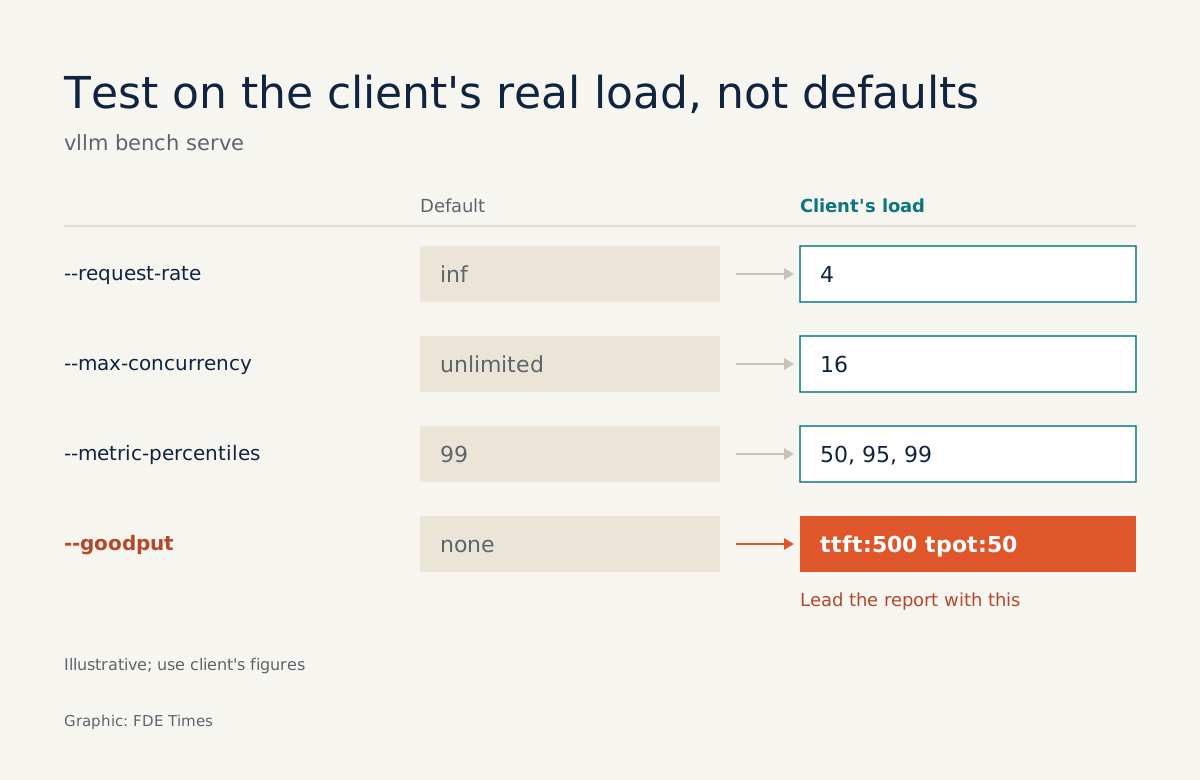
- Only p99 is reported by default; add --metric-percentiles 50,95,99 and --goodput so the report is anchored to the customer's SLO.
- Every tool defines its metrics in its own way, so the report must state the definition behind each number.
The customer’s infrastructure team asks you one question: “How many users can this endpoint serve?” You run vllm bench serve with the default settings and get a very attractive throughput number.
The problem is that, by default, the tool sends every request at once and places no limit on concurrent requests. That attractive number measures a scenario the customer’s system will never face.
This guide covers how to measure three groups of metrics: time to first token (TTFT), latency between tokens (ITL, TPOT) and throughput. It then shows how to package the results so an infrastructure engineer can read them and make a decision straight away.
When a customer self-hosts a model, the capacity question tends to arrive early, and you need numbers solid enough to defend in front of people who know infrastructure better than you do.
What do you need?
You need a running OpenAI-compatible vLLM endpoint (local or the customer’s), a client machine with vLLM installed so the vllm bench serve command is available, and, most importantly, three pieces of information from the customer: the maximum number of concurrent requests their client side sends, the rate at which requests arrive, and their latency SLO.
Without these three you can still measure, but only for your own benefit.
One caveat before starting: all the metrics below are measured at the benchmark client. The vLLM documentation defines TTFT as the time from when a request is sent until the first output stream reaches the client.
So place the client machine close to where the customer’s real clients sit. Measuring from a laptop over a VPN adds network latency to the results.
Step 1: run the sample command for a baseline
The vLLM documentation gives a sample command that benchmarks the /v1/completions endpoint with the ShareGPT dataset, specifying model, backend and endpoint:
vllm bench serve \
  --model NousResearch/Hermes-3-Llama-3.1-8B \
  --backend vllm \
  --endpoint /v1/completions
This is a shortened version: the command above leaves out dataset selection and the customer’s host address. Run vllm bench serve --help on the version you are using to get the exact names of those parameters. If you choose the random dataset, each request defaults to 1024 input tokens and 128 output tokens.
Check: the output should include request throughput, output token throughput (tok/s) and total token throughput. If all three lines are there, the client has reached the endpoint. Do not take this number to the customer; it only confirms that everything is connected correctly.
Step 2: reproduce the customer’s load
Two parameters decide which question your benchmark answers. --request-rate defaults to inf, meaning every request is fired at once: a classic maximum-throughput test.
With a finite value, requests arrive following a Poisson distribution, which is closer to real traffic. --max-concurrency caps the number of requests in flight at once. Left empty, there is no cap at all. Add these two parameters to the command from step 1:
  --request-rate 4 \
  --max-concurrency 16
The values 4 and 16 here are hypothetical. Replace them with the figures the customer gives you, such as the maximum number of connections their gateway’s connection pool opens.
Check: rerun at several --max-concurrency levels, for example 1, 8, 16 and 32. NVIDIA’s benchmarking documentation distinguishes two kinds of throughput. System-wide throughput is the total output tokens across all requests running in parallel, while per-user throughput is the rate a single user receives.
As concurrency rises, these two move in opposite directions. If your numbers show that trend, the measurement is sound.
Step 3: report percentiles, not averages
The --percentile-metrics parameter chooses which metrics get percentiles. For text-generation models the default is ttft,tpot,itl. The --metric-percentiles parameter chooses which percentiles to report, and by default that is only p99. The infrastructure team needs the whole distribution, so add:
  --percentile-metrics ttft,tpot,itl \
  --metric-percentiles 50,95,99
Understand these three metrics before explaining them to anyone else. ITL records the gap between two consecutive output streams, pooled across all successful requests. TPOT is computed per request, from end-to-end latency minus TTFT.
A hypothetical example helps: a request takes 3,000 ms end to end, TTFT is 450 ms, and it generates 128 tokens.
The part after the first token takes 2,550 ms; spread evenly over the remaining 127 tokens, that is roughly 20 ms per token. This is only a back-of-the-envelope estimate; the official figure in your report is the TPOT the tool prints.
Users experience these two metrics differently. NVIDIA describes TTFT as how long you wait before seeing the model’s output. For a chatbot, that is the sense of whether the system is responding at all. TPOT and ITL determine whether the text streams smoothly or stutters.
Step 4: put the customer’s SLO into the command
A report becomes useful when it answers “how many requests met the requirement”, not just “what was the average”. --goodput takes latency SLOs in milliseconds as KEY:VALUE pairs, with the keys ttft, tpot and e2el:
--goodput ttft:500 tpot:50Here 500 and 50 are hypothetical SLOs. The result tells you how many requests meet the customer’s SLO. That is the number to put at the top of your report.
Check: keep --goodput fixed and sweep the --max-concurrency levels from step 2, recording both request throughput and goodput at each level. At low levels the two numbers are almost identical, because most requests meet the SLO.
At some point request throughput keeps rising but goodput stalls or falls: requests still finish, just too slowly. The concurrency level just before that divergence is the answer you take to the infrastructure team.
Step 5: fix output length and save the results
If the model stops early on an EOS token, the number of output tokens varies between runs and throughput cannot be compared. --ignore-eos forces the model to generate the full length. --save-result writes the results to a JSON file you can send on.
  --ignore-eos \
  --save-result
Check: open the JSON file and confirm the percentiles from step 3 are in it. This file is your evidence, so each file should map to exactly one configuration.
Putting it together into one command
Combining the parameters from steps 1 to 5 gives a command you run once per concurrency level:
vllm bench serve \
  --model NousResearch/Hermes-3-Llama-3.1-8B \
  --backend vllm \
  --endpoint /v1/completions \
  --request-rate 4 \
  --max-concurrency 16 \
  --percentile-metrics ttft,tpot,itl \
  --metric-percentiles 50,95,99 \
  --goodput ttft:500 tpot:50 \
  --ignore-eos \
  --save-result
This is still a shortened version: add the dataset and host parameters from --help yourself, and replace 4, 16, 500 and 50 with the customer’s figures. When sweeping concurrency, change only the --max-concurrency value each time so the JSON files remain comparable.
Mistakes that make the numbers fall apart
The most common mistake is running several times in a row against the same server. The vLLM documentation warns that on repeated runs the server may retrieve earlier prompts from the prefix cache, pushing throughput above what is realistic.
The fix is to change the seed between runs or restart the server. The second mistake is leaving concurrency unlimited when measuring the customer’s endpoint, so the results reflect overload rather than real load.
The third is harder to spot: comparing your numbers with ones the infrastructure team measured using a different tool. NVIDIA notes that each tool implements metrics in its own way, for example whether TTFT is included in ITL, and that results should only be compared when the definitions match.
What should the report for the infrastructure team look like?
Put a definitions table directly above the results, so nobody has to guess:
| Metric | Definition in the report |
|---|---|
| TTFT | From sending the request to the first output stream, measured at the client |
| ITL | Gap between two consecutive output streams, pooled across all successful requests |
| TPOT | Computed per request from end-to-end latency minus TTFT |
| System throughput | Total output tokens per second across all requests running in parallel |
| Goodput | Number of requests meeting the SLO declared in –goodput |
Below the table, include the exact command you ran, the --max-concurrency and --request-rate values with the reasoning behind them, p50/p95/p99, goodput and the JSON file. With all of that an infrastructure engineer can rerun the measurement, and when their rerun gives the same results, they will trust your numbers.
On a CV, a line such as “benchmarked a vLLM endpoint against customer SLOs, reporting p50/p95/p99 and goodput” carries far more weight than “experience optimising LLM inference”.
If the job descriptions you are targeting mention latency or self-hosted models, have a sample report like this ready and be prepared to explain why you chose each concurrency level.
A maximum-throughput number only tells you how powerful the server is. The infrastructure team needs to know how many of their users are served within the SLO, and that answer lies in --max-concurrency and --goodput.
Was this article useful?
Thanks for the feedback!