Diagnosing a warehouse robot fleet: reading logs like a Forward Deployed Robotics Engineer
When a robot drops a box, guessing the cause is quick. To narrow it down to hardware, latency or model behaviour, you first have to reproduce the failure and then line up commands against responses in the log.

In brief
- At Physical Intelligence, the Forward Deployed Robotics Engineer is the robot fleet's first line of technical defence, covering ticket analysis, failure reproduction and diagnostic data collection.
- Reproduce the failure at the robot station before diagnosing it; MCAP, the default log format of ROS 2, is what you will open to read.
- A failure is only truly fixed once you have checked whether it recurs on other robots and reported that pattern back to the design team.
Picture a new ticket landing in the queue at the start of a shift: “Robot at station 7 dropped a box.” No photo, no timestamp, just an impatient warehouse operator. You could guess straight away: a worn gripper, a dirty camera, or a model gone haywire. All three sound plausible. And guessing like that is the shortest route to losing two days.
Physical Intelligence describes its Forward Deployed Robotics Engineer role as the first line of technical defence for a growing robot fleet. The robots run in warehouses and in external data-collection environments.
The duties are listed plainly: analyse tickets from the field, reproduce failures, collect diagnostic data and follow through until the issue is resolved.
This skill is not only for people who build robots. Reading multi-stream data along a timeline, narrowing down the cause and turning a one-off incident into a lesson for the whole system is the job of any FDE who has to debug production on real data.
The difference with robots is that a wrong guess leaves visible evidence at once: a box lying on the warehouse floor.
First in is not necessarily first handled
The job description asks for the ticket queue to be prioritised by impact on the whole fleet and by operational goals, not by arrival order. So the first question about the station 7 ticket is not “why” but “is it happening anywhere else?”
Imagine you filter the queue for the keywords “drop” and “gripper” over the past week and find three other stations reporting a similar failure, all running the same firmware version. At that point the station 7 ticket is no longer a single robot’s incident.
It is a symptom of a fleet-wide problem, and it belongs at the top of the queue. If, on the other hand, only station 7 is affected, you are looking for something specific to that station: its hardware, layout, lighting or type of box.
Bash is all this step needs. A grep -il "dropped\|drop" tickets/*.txt | xargs grep -h "station" followed by sort | uniq -c gives you a first picture in thirty seconds. No dashboard required.
No reproduction, nothing to diagnose
The next step is the one many software engineers want to skip: go to the station. Physical Intelligence spells out the duty of physically inspecting and running functional tests at the robot station to confirm that a failure can be reproduced. A failure that cannot be reproduced might be a box placed off-centre exactly once, or an operator reporting the wrong robot.
At station 7, you have the robot pick the same type of box repeatedly. Suppose that after 40 picks, 6 end in a drop. This is a number you produced under conditions you control and, more importantly, you know exactly when those 6 drops happened. Those timestamps are the key to opening the log file.
The log is where the data streams sit side by side
On a robot running ROS 2, what you open is usually an MCAP file. It is an open-source container format for multimodal log data and the default log format of ROS 2.
It can record and replay binary messages in any format. A single file can hold camera images, joint states, commands sent to the gripper and the force sensor stream all at once.
A common mistake is to open the whole file in a visualisation tool and drag the timeline around aimlessly. Do the opposite: slice exactly the few seconds around each drop and read only the relevant topics. The script below illustrates the idea. The topic and file names are only examples; substitute the names from the real system.
from mcap.reader import make_reader
from mcap_ros2.decoder import DecoderFactory

TOPICS = ["/gripper/command", "/gripper/state"]
DROPS = [1730955612.4, 1730955987.1]  # timestamps of the drops during reproduction
WINDOW = 3.0  # seconds before and after each drop

with open("station7_repro.mcap", "rb") as f:
    reader = make_reader(f, decoder_factories=[DecoderFactory()])
    for _, channel, message, msg in reader.iter_decoded_messages(topics=TOPICS):
        t = message.log_time / 1e9
        if any(abs(t - d) <= WINDOW for d in DROPS):
            print(f"{t:.3f}  {channel.topic:18}  {msg}")
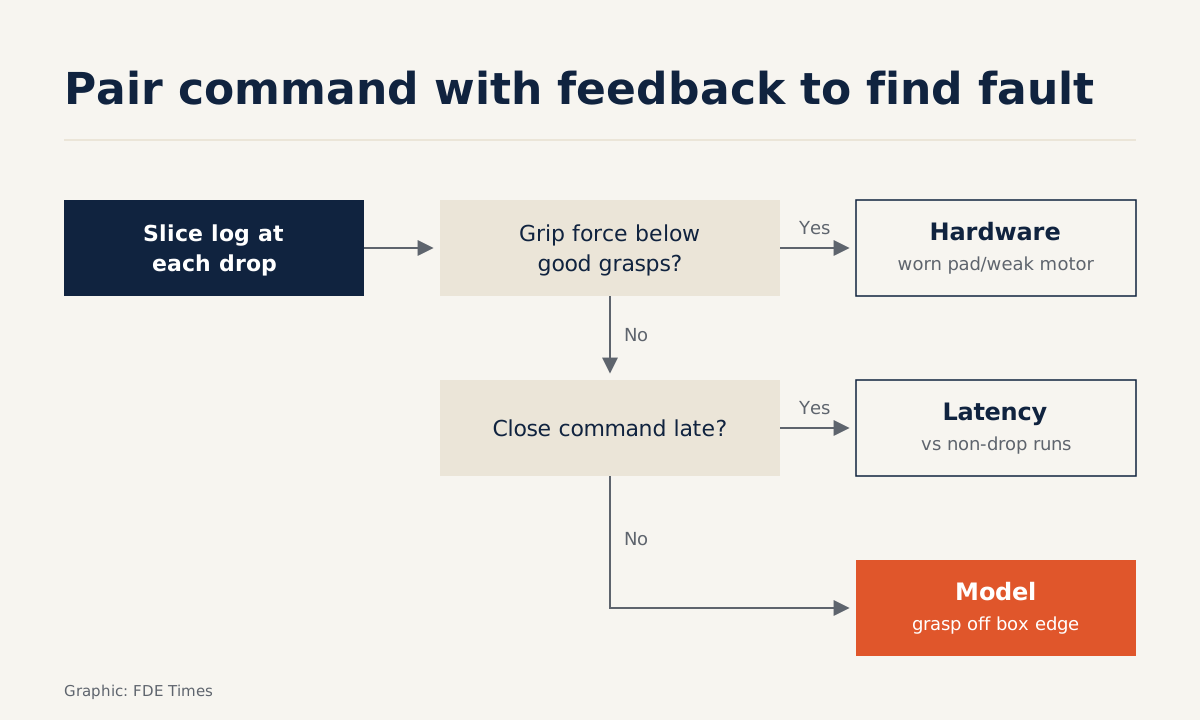
The result is a short timeline in which commands and responses sit right next to each other. Read it like a conversation: the robot issues “close gripper”; what does the gripper answer, and after how long?
Three stories a timeline can tell
Consider three outcomes. Story one: the close command is sent, but the gripper state reports a clamping force well below that of successful picks. That points towards hardware: worn gripper pads or a weak motor.
Story two: the close command arrives late relative to the moment the gripper touches the box. That points towards latency in the system. Compare that latency across the picks that dropped and the ones that did not.
Story three is the hardest: the hardware responds correctly, latency is normal, but the gripper chooses a grasp point well off the edge of the box. Now you have to ask about the model.
Physical Intelligence writes that π0.5 aims to generalise to new environments, and that its experiments were carried out in homes not included in the training data.
When it open-sourced π0, it also said plainly that this was experimental, because π0 was developed for its own robots.
For the person diagnosing, those statements are a reminder about expectations: the field environment may differ sharply from anything the model saw in training. A new type of box, glossy tape or unfamiliar lighting can all change the model’s behaviour without a single component failing. Record the camera images from each drop.
Physical Intelligence says that between 1 and 20 hours of data was enough to fine-tune π0 for a range of tasks, so carefully recorded failure scenes can be useful to the training team too, not only to your ticket.
Closing the ticket is only half the job
The job description includes one more duty that is easy to forget: identify recurring failures across the fleet and point out durability weaknesses so the design team can improve them.
If the gripper pads at station 7 wear out after a certain number of cycles, the next question is how many cycles the other stations have run. Replacing the pads fixes one robot. Telling the design team the pads need to be more durable fixes the fleet.
A good root cause report needs only one page: the symptom, how it was reproduced and the failure rate, the log excerpt as evidence, the cause, the on-site fix, and the pattern reported back to the design team. Write it in the same template every time and after a few months you have a dataset that shows which failures keep recurring.
Mistakes that drag a diagnosis out
The most common mistake is diagnosing before reproducing: fixing on a hypothesis, seeing the failure vanish for five minutes and closing the ticket, when at a failure rate of 6 in 40, five minutes proves nothing.
The second is concluding “the model is wrong” or “the hardware is broken” simply because that is the part you know best. The third is reading the entire log instead of narrowing it to the right time window, and the last is closing the ticket without ever asking whether other stations have the same problem.
How to prove this skill when job hunting
Physical Intelligence’s requirements state at least 2 years of experience in debugging and root cause investigation, along with experience analysing logs and writing diagnostic scripts in Python or Bash. Against a job description like that, “experienced in debugging” on a CV convinces nobody.
Be specific. For example: “Wrote a Python script to slice logs around incidents, cutting the time needed to find the cause of an intermittent failure”, accompanied by a root cause report with sensitive details removed.
In interviews, walk through a failure in the same order as this article: how you prioritised it, how you reproduced it, what the log showed, and what you reported back to the design team.
The robot at station 7 will drop boxes again, and so will station 12. The person trusted in the field is the one who knows how to find, in the log, the exact moment the box fell.
Was this article useful?
Thanks for the feedback!