Load testing an API before go-live: p95 thresholds, throughput and caching checks with k6
An average latency that looks fine can still hide the slow requests your client's users will hit on launch day.
In brief
- Set targets in p95 and requests per second, not average latency.
- When a k6 threshold breaks, the exit code is non-zero, so a load test can act as a gate in CI/CD.
- Caching is the first lever to pull, but personalised responses must be marked private.
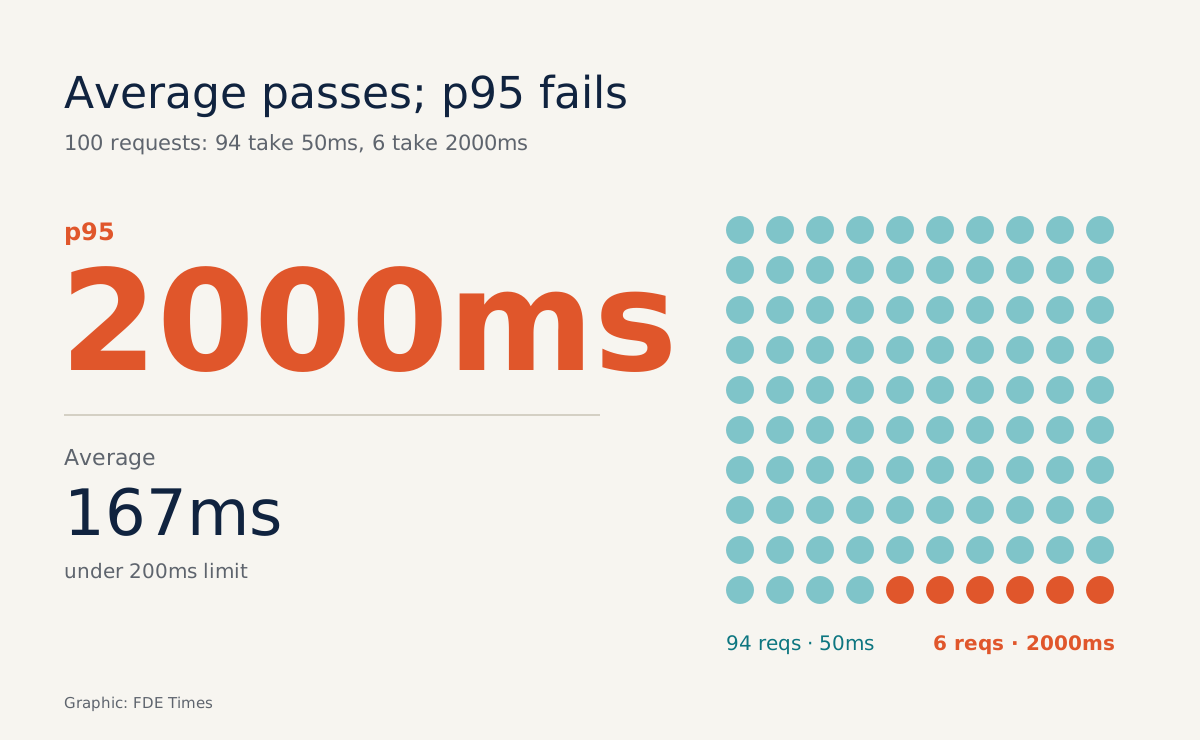
Picture 100 requests hitting an API: 94 return in 50ms, six take 2000ms. The average is 167ms, under a 200ms threshold, and the report sent to the client will say “pass”. But the p95 of that same set is 2000ms: six in every 100 users wait two seconds.
Google’s SRE book calls the belief that most requests sit close to the average wishful thinking. For a Forward Deployed Engineer, this stops being theory in the week before go-live: the client needs to know whether the system will survive launch day, and you are the one who has to answer with numbers.
This guide walks through a workflow you can run on a laptop. You will write a load-test script with pass/fail thresholds, run it as a gate in the pipeline, ramp up load to find where p95 starts to bend, then add caching without leaking data between users.
What do you need before you start?
You need k6 installed, a staging environment for the API (do not fire load at the client’s production), access to the staging dashboards for CPU, memory and the database, and curl.
If the client’s team is more at home with Postman, Postman can also run virtual users in parallel through a sequence of requests and set pass conditions on the average, p90, p95 or p99. The thinking below applies to both tools.
More important than the tool is a short conversation with the client. You need two numbers: the target load and the acceptable latency.
Step 1: fix the target in requests per second and p95
Grafana Labs’ guide to API load testing notes that load is usually reported as a request rate, per second or per minute. So do not ask the client “how many users do you have?”; ask “at peak, how many requests per second hit this endpoint?” A user count has to be converted; requests per second can be measured directly.
For latency, the standard pattern Grafana gives is that 95% of requests must complete in under 200ms. Write your target in exactly that form.
If your API is called by a frontend that fans out to several backends, tighten it further: Google’s SRE book warns that a backend’s p99 can easily become the median latency at the frontend, because a page calling many backends will regularly hit at least one slow request.
Check after this step: you have one line you can put in the test plan, for example “endpoint /orders, 500 requests per second, p95 under 200ms, errors under 1%” (the load figure here is hypothetical), and the client has agreed to it.
Step 2: turn the target into k6 thresholds
k6 expresses pass/fail criteria as thresholds. The k6 documentation describes a threshold that evaluates the HTTP error rate through the http_req_failed metric, and an abortOnFail property that, set to true, stops the test as soon as the threshold is breached.
The script below is a trimmed-down version: it uses a fixed number of virtual users for readability, the URL is hypothetical, and you should check the syntax against the documentation for the k6 version you are using.
// load.js — condensed sketch
import http from 'k6/http';

export const options = {
  vus: 20,
  duration: '2m',
  thresholds: {
    http_req_duration: [{ threshold: 'p(95)<200', abortOnFail: true }],
    http_req_failed: ['rate<0.01'],
  },
};

export default function () {
  http.get('https://staging.example.com/api/orders');
}
abortOnFail is worth enabling when the system is clearly broken: there is no point waiting the full two minutes to learn that p95 has shot up to several seconds. Setting an error threshold alongside the latency one matters just as much, because an API that returns 500 errors very quickly still has a handsome p95.
VUs are not requests per second
Step 1 fixed the target in requests per second, yet the script declares 20 VUs. The two are linked by simple arithmetic: each VU loops continuously, so throughput is roughly the number of VUs divided by the time one iteration takes. With 20 VUs and 50ms per request, you get around 400 requests per second in theory.
The trap runs the other way. When the system slows and each request takes 200ms, the same 20 VUs produce only about 100 requests per second: the test eases off the load exactly when the system is weakest, and p95 looks kinder than reality.
So use the conversion only to estimate a starting number of VUs. After each run, compare the requests per second actually achieved with the target in the test plan; if it falls short, increase the VUs and run again until you reach the target.
Step 3: run it and let the exit code decide
k6 run load.js
echo $?
Grafana Labs stresses that when a test fails, the k6 CLI returns a non-zero exit code, which is the precondition for automation. You can put this command in the CI/CD pipeline before the deploy step: if a threshold breaks, the pipeline goes red and the build does not ship.
Check after this step: deliberately lower the threshold to p(95)<1 and run again. If echo $? still prints 0, your gate is not blocking anything.
Step 4: ramp up in steps, then spike
A single run at fixed load only tells you the system is fine at one level. Go-live day usually looks different: load surges suddenly when the client sends an announcement email or switches on a feature. Grafana classifies test types by purpose, and a spike test is the one that shows how the system reacts to a sudden, large surge in traffic.
The simplest approach, with no new configuration: edit vus in load.js and rerun at each level, recording the requests per second achieved, p95 and error rate each time. This is a manual ramp-up, simplified to keep it easy to follow. The table below holds hypothetical illustrative figures for one endpoint, to show what the curve you are looking for looks like.
| Load level | Requests/second achieved | p95 | Error rate |
|---|---|---|---|
| 10 VUs | 180 | 60ms | 0% |
| 20 VUs | 350 | 75ms | 0% |
| 40 VUs | 600 | 140ms | 0% |
| 60 VUs | 640 | 380ms | 0.2% |
| 80 VUs | 610 | 900ms | 3% |
Read the table through the four golden signals proposed by Google SRE: latency, traffic, errors and saturation. Between 40 and 60 VUs, traffic barely moves, staying around 600–640 requests per second, while p95 nearly triples and errors only edge up. The SRE book notes that rising latency is often a leading indicator of saturation, and this is exactly that picture.
The real ceiling of this hypothetical endpoint is around 600–640 requests per second, not 80 VUs, where errors spill over. When you see p95 bend, open the staging dashboards and look for the resource about to run out: CPU, the database connection pool or a queue. k6 only gives you the first three signals.
For the spike, hold a baseline at 10 VUs and then jump straight to a level several times the client’s expected peak, rather than ramping up gradually. The question to answer is whether the system returns errors en masse or merely slows down and then recovers.
Step 5: add caching and run again
When p95 breaches the threshold on a read endpoint, caching is usually the first lever. Nordic APIs explains why simply: putting responses in a cache avoids unnecessary database queries. But caching on a client project has a data trap.
MDN is explicit: if a response contains personalised content and you want it stored only in a private cache, you must specify the private directive. Without it, a shared cache such as a CDN or proxy could serve one person’s orders to someone else. Check the current headers:
curl -I https://staging.example.com/api/ordersThe second layer is revalidation with ETag. According to MDN, the server returns 304 Not Modified when the ETag it computes for the resource matches the If-None-Match value in the request, so the full payload does not have to be sent again. Try it by copying the ETag from the previous command into the placeholder below:
curl -I -H 'If-None-Match: "<etag-just-received>"' https://staging.example.com/api/ordersCheck after this step: personalised responses carry private, a request with If-None-Match gets a 304, and rerunning the load levels from Step 4 shows the point where p95 bends shifting to the right. Note that a k6 script hitting one URL repeatedly will get a higher cache-hit rate than real traffic; vary the parameters if you want honest numbers.
Common mistakes
The most common mistake is reporting average latency, as in the 167ms example at the start. The second is setting only a latency threshold and forgetting the error rate. The third is reporting the number of VUs instead of the requests per second actually achieved, when fixed VUs ease off the load as the system slows.
The fourth is running a load test against a shared environment without telling the client’s team, leading others to think the system is down. The fifth is measuring after enabling the cache without keeping the earlier results table, so you cannot prove how much things improved.
How do you take this skill to a client?
Imagine the client’s CTO asking: “If we open this to every branch tomorrow, will it hold?” The most convincing answer you can give is a test plan in requests per second, a script that lives in the pipeline, and a table of p95 at each load level before and after caching.
If you are moving into an FDE role, look for phrases in job descriptions such as “production readiness”, “performance” or “go-live support”. On your CV, instead of “experienced in load testing”, write one specific line: “set p95 and error-rate thresholds in k6 as a CI gate before deploy, found the load ceiling through ramp-up and spike tests, reduced p95 with Cache-Control and ETag”.
On launch day, the client will not ask you for the average. They will only care whether anyone had to wait.
Was this article useful?
Thanks for the feedback!
6 sources
- API load testing: A beginner's guide (Grafana Labs) · 2024-01-31
- Thresholds | Grafana k6 documentation
- Monitoring Distributed Systems (Google SRE Book)
- Simulate user traffic to test your API performance (Postman Docs)
- 10 Tips for Improving API Performance (Nordic APIs) · 2023-11-08
- HTTP caching (MDN Web Docs)