Observability for LLM systems: trace every request, control logging and reconcile costs
A customer asks why this week's bill has jumped. You can only answer if every model call has left behind a span recording its tokens, the feature and the customer.
In brief
- Every model call should be a span carrying the model name, input tokens, output tokens and your own business attributes.
- Record cost per request in the application; use Anthropic's Usage & Cost Admin API for daily reconciliation, not for counting individual requests.
- Turn on prompt-content logging only when needed (opt-in), and route that content through sampling, payload limits and redaction.
A customer’s internal chatbot has been running smoothly for three weeks. Then, one Monday morning, the head of their finance team sends a screenshot of the API bill with a single question: which feature, and which department, drove last week’s increase?
If all you have is a few print(response) lines scattered through the code, you will spend the whole day guessing. If you have traces, the answer takes one query. Customers trust an FDE who can answer on the spot; an FDE who has to guess usually ends up apologising.
This guide shows how to build observability for an LLM application in three layers: traces that show where a request went, controlled logging of content, and cost recorded in two places and reconciled against each other.
Traces are the backbone, not logs
Langfuse defines application tracing as recording the full lifecycle of a request as it moves through a system. In an LLM application, that lifecycle rarely consists of a single model call. There is usually a document retrieval step, one or more model calls, and sometimes agent tool calls as well.
The smallest unit of a trace is the span. Braintrust’s guide to LLM tracing with OpenTelemetry describes a span as a unit of work. Each model-call span carries standard attributes such as gen_ai.request.model, gen_ai.usage.input_tokens and gen_ai.usage.output_tokens.
Why follow the standard instead of inventing your own names? Because following it keeps you free to choose a backend later. Datadog supports the OpenTelemetry GenAI Semantic Conventions natively, from version v1.37 of the conventions onwards.
You instrument once with OpenTelemetry, then send the data to whichever backend fits, including the monitoring tool the customer already uses.
A practical caveat: the GenAI conventions were still changing, at least as of February 2026. They have also moved to a separate OpenTelemetry repository, and the old semconv pages are no longer maintained. When looking up attribute names, read the new repo.
What does a good span look like?
Take a concrete example: the customer’s chatbot receives a question, retrieves documents, then calls Claude. The Python below wraps the model call in a span. The gen_ai.* attributes come from the standard; the app.* attributes are your own project conventions.
from opentelemetry import trace
import anthropic

tracer = trace.get_tracer("support-bot")
client = anthropic.Anthropic()

def answer(question, docs, customer_id, feature):
    with tracer.start_as_current_span("chat") as span:
        span.set_attribute("gen_ai.request.model", MODEL)
        span.set_attribute("app.customer_id", customer_id)
        span.set_attribute("app.feature", feature)

        resp = client.messages.create(
            model=MODEL,
            max_tokens=1024,
            system=SYSTEM_PROMPT,
            messages=[{"role": "user",
                       "content": build_prompt(question, docs)}],
        )

        u = resp.usage
        span.set_attribute("gen_ai.usage.input_tokens", u.input_tokens)
        span.set_attribute("gen_ai.usage.output_tokens", u.output_tokens)
        span.set_attribute("app.cache_read_tokens",
                           u.cache_read_input_tokens or 0)
        span.set_attribute("app.cache_creation_tokens",
                           u.cache_creation_input_tokens or 0)
        return resp
It is the two attributes app.customer_id and app.feature that answer the finance team’s question. Tokens without business context are just a number. Once every span carries a feature name, grouping by app.feature shows immediately which feature is consuming the tokens.
There is also a reason to record cache tokens separately. Anthropic’s usage endpoint measures uncached input, cached input, cache-creation tokens and output tokens separately. If your traces lump them into one figure, you will never be able to match the provider’s numbers.
Cost must be recorded in two places
Many engineers assume that pulling cost data from the provider is enough. It is not, and the provider’s own documentation explains why.
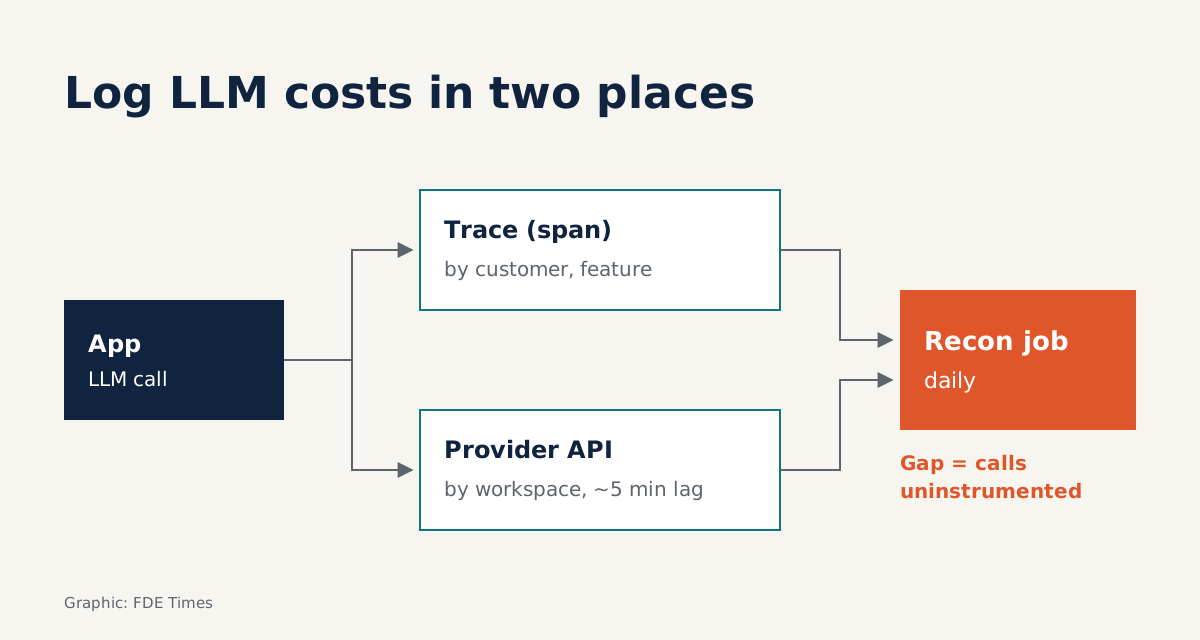
Anthropic’s Usage & Cost Admin API gives programmatic access to an organisation’s historical usage and cost data, much like the Usage and Cost pages in the Console. But the data is not immediate: it typically appears about five minutes after a request completes, sometimes later.
In addition, the Cost API returns only USD per day, while the usage endpoint uses buckets of 1m, 1h or 1d. Data is broken down by workspace, not by your end customers or features. That makes it suitable for reconciliation, not for costing individual requests.
| Recorded in the application (traces) | Provider API | |
|---|---|---|
| Granularity | Per request, per span | 1m/1h/1d buckets for usage; daily for cost |
| Breakdown | By customer, feature, tags you attach | By workspace |
| Latency | Near real time | Typically about 5 minutes, sometimes longer |
| Purpose | Debugging, internal cost allocation | Reconciling against the bill for finance |
On the application side, Langfuse records usage and cost for each generation. It ships with a list of common models and their tokenizers so it can infer cost automatically. When you send actual figures, ingested values take precedence over inferred ones.
Langfuse’s Metrics API can also aggregate usage and cost by user, tag or application type.
Advice: always send the real token counts from the response rather than letting the tool count them. Tokenizer-inferred figures are a fallback; do not treat them as the source of truth.
Reconciliation: the Priority Tier and Admin key traps
The idea behind the reconciliation job is simple. Each morning, sum yesterday’s tokens from your traces, pull the same day’s figures from the usage endpoint, and compare the two. A large gap most likely means some model call path has not been instrumented.
Two details trip people up. The API requires Admin credentials; workspace API keys will not work, so request access from the customer early rather than leaving it until acceptance week. And Priority Tier costs use a different billing model and are not included in the cost endpoint, so they must be tracked through the usage endpoint.
Content logging: only switch it on deliberately
When debugging a wrong answer, you will want to see the exact prompt and completion. The OpenTelemetry GenAI conventions define the attributes for recording prompt content as opt-in, meaning nothing is recorded by default. That design makes sense: enterprise customers’ prompts often contain people’s names, contract numbers and internal data.
Braintrust’s guide stresses that production LLM tracing needs careful configuration of sampling, batching, payload limits and redaction. A sensible order is to write the redaction function first, set a payload size limit, choose a sampling rate for content, and only then enable recording.
On performance, the Langfuse SDK sends trace data asynchronously in the background, so tracing does not block request handling. But asynchronous does not mean free: larger payloads cost more in bandwidth and storage.
In what order should you build it?
First, list every place in the code that calls a model, including calls inside agent loops. Wrap each one in a span with the standard gen_ai.* attributes, plus two or three business attributes the customer actually cares about.
Next, choose a backend based on the customer’s infrastructure. If you need a dedicated LLM tool with built-in costing, use Langfuse. If the customer already runs Datadog, send the OpenTelemetry data there. Only then build the daily reconciliation job, and configure redaction before turning on content logging.
Common mistakes
The most common mistake is tracing only the main model call and missing secondary calls such as summarisation, classification or retries. The reconciliation job will expose this quickly, provided you have built one.
The second is treating the Cost API as a real-time meter and firing false alerts because the data has not arrived yet. The third is logging full prompt content from day one, then having to delete it when the customer’s security team finds out.
For developers looking to move into FDE work, this is an easy skill to demonstrate. On a CV, do not write “experienced in observability”. Write that you attached business attributes to traces and could answer cost questions per feature. When reading job descriptions, terms such as OpenTelemetry, Langfuse or cost attribution signal that the role includes this work.
This week’s exercise
Take a small LLM application you have written, instrument it following the code above, and run 50 requests with two different app.feature values. Then answer with a single query: which feature uses more output tokens, and by what multiple?
If you can do that in five minutes, you are ready for that Monday morning and its screenshot of the bill.
Was this article useful?
Thanks for the feedback!
7 sources
- Usage and Cost API
- Token & Cost Tracking - Langfuse Docs
- Observability & Application Tracing - Langfuse Docs
- Datadog LLM Observability and OpenTelemetry GenAI Semantic Conventions · 2025-12-01
- OpenTelemetry LLM tracing guide (Braintrust) · 2026-07-02
- How to Monitor LLM Applications with OpenTelemetry GenAI Semantic Conventions (OneUptime) · 2026-02-06
- Semantic conventions for generative client AI spans (OpenTelemetry)