Three Kurose and Ross chapters for debugging a client's network
There is no need to read all eight chapters: three of them, plus the free Wireshark labs, are enough to dissect a broken connection.

In brief
- Pearson released the 9th edition in summer 2025, adding HTTP/3, QUIC and TLS 1.3
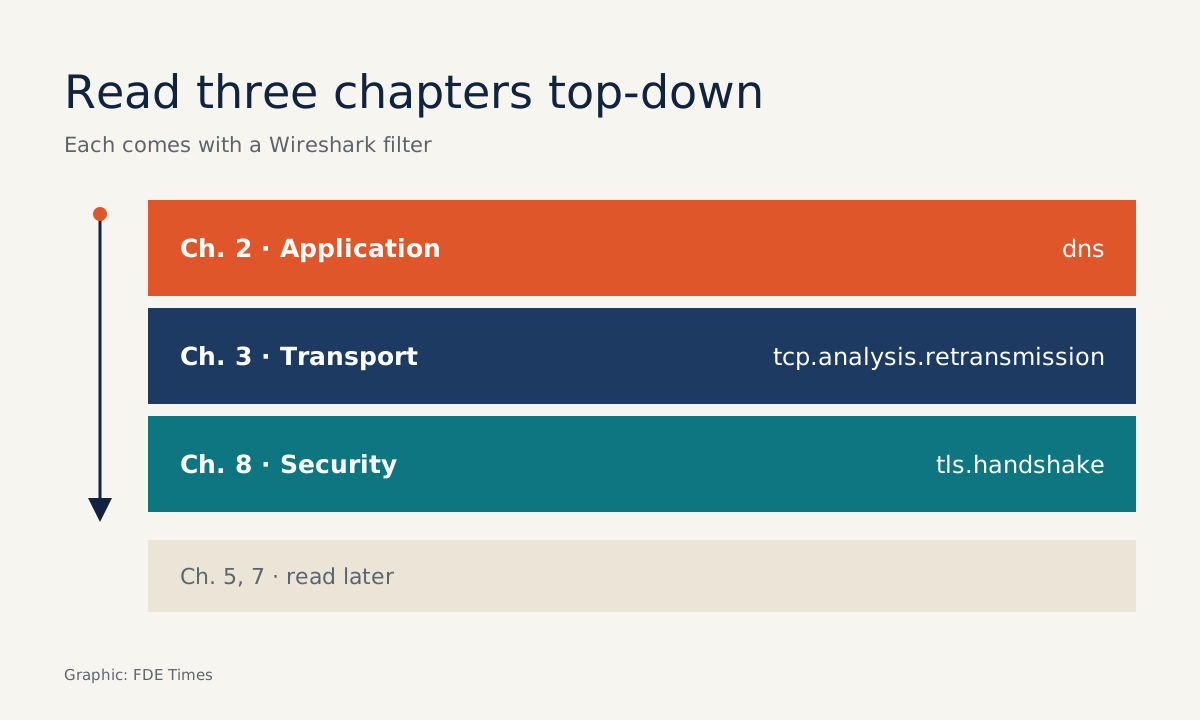
- For FDEs, chapters 2, 3 and 8 come first; chapters 5 and 7 can wait until needed
- The Wireshark labs, free to everyone, are what turn knowledge into skill
Picture an afternoon at a client’s office. They say every API call takes several seconds, while your server logs show processing takes only a few tens of milliseconds. The gap sits somewhere along the path, and the person who has to show exactly where is you.
It is a familiar moment for an FDE. You are sitting inside someone else’s network, with their proxies, their certificates and their Wi-Fi, and there is no infrastructure team to take the load. For many engineers used to working at the application layer, it may also be the first time they need to look closely at individual packets.
Computer Networking: A Top-Down Approach by James F. Kurose (UMass Amherst) and Keith Ross (NYU Abu Dhabi) was not written for FDEs. But read the right chapters, alongside the Wireshark labs the authors give away free to instructors, students and readers, and it gives you exactly what that afternoon demands.
Top-down matches the order in which clients complain
The 9th edition arrived in summer 2025; Pearson lists the release date as 20 June 2025. It is available to read online, rent or buy in print. Its eight chapters run from “Computer Networks and the Internet” to “Security in Computer Networks”, and Pearson describes the approach as presenting this complex subject from the top down.
That top-down approach is why the book suits FDEs. Clients never report faults by network layer. They report what they see: a page that will not load, a request that hangs, a certificate warning in red. Starting at the application layer and working down is precisely how a good debugger asks questions.
Chapters 2 and 3 are where most incidents begin
Chapter 2 (Application Layer) in this edition has been updated for HTTP/3 and QUIC, exactly what to read before debugging a client’s web or API traffic. Chapter 3 (Transport Layer) updates congestion control and completes the QUIC material begun in chapter 2, so the two should be read together.
Between them, these chapters cover nearly every place the missing seconds in a “slow API” case can go: name resolution, connection setup and packets dropped in transit. The most effective way to use them is to take them straight into a packet capture.
Tracing a “slow API” case in Wireshark
Ask the client’s permission, then capture packets on the affected machine while reproducing a single API call. Do not try to take in the whole capture at once. Filter it layer by layer, in the order the book teaches. The numbers below are illustrations of what a bad result might look like, not standard thresholds.
First, type the filter dns and compare the time of each query with the time of its response.
Suppose a normal query is answered in about 20 milliseconds, but the client’s capture shows the query being resent twice and the response arriving after 1.5 seconds: most of the delay happened before HTTP even started, and that is chapter 2 territory.
Second, filter on tcp.analysis.retransmission so Wireshark shows only retransmitted segments. Imagine a call of 400 segments in which 40 are retransmitted, or 10%: packets are being lost in transit, and chapter 3 gives you the vocabulary to explain why the connection’s throughput is then throttled.
If you see only one or two stray lines, the culprit is probably elsewhere. And if filtering on tcp shows almost nothing, try quic, because the connection may be running over HTTP/3.
Third, filter on tls.handshake to see how far the handshake gets. If, for example, the client sends its opening hello and then waits several seconds with no reply, or the handshake ends in an error alert, you have found the break. Only when all three steps come up clean should you measure the time from sending the request to receiving the first byte of the response.
At that point, what you say to the client changes completely. Instead of “let me look into it”, you can say “your connection is retransmitting packets repeatedly before the request reaches the server”. The first only buys time; the second points to the fix.
Three mistakes are easy to make here:
- You capture on your own laptop rather than on the client’s real path, so your capture is clean while the client is still slow.
- You draw conclusions from a single capture, when the problem may appear only at peak times.
- You blame “the network” before checking DNS, even though DNS is the cheapest thing to rule out.
Chapter 8 when the fault is in the handshake
Chapter 8 (Security) of the 9th edition adds TLS 1.3 and WPA3, exactly what you need when certificates or handshakes fail in a client’s environment. Read it to understand how a correct handshake proceeds before you go looking for where it breaks.
Two other chapters are worth knowing but can wait. Chapter 5 (Network Layer: Control Plane) adds material on SDN, using Google’s Orion network control system as a case study, which helps when you have to deal with a client’s routing or cloud networking.
Chapter 7 (Wireless and Mobile Networks) is the most heavily rewritten in this edition, covering Wi-Fi 6 and 5G. Open it when the problem lies in the Wi-Fi or mobile network at the client’s own office.
The Wireshark labs turn reading into doing
The authors’ lab page says the basic tool for observing the messages exchanged between protocol entities is a packet sniffer. The labs teach exactly that skill, covering HTTP, DNS, TCP, UDP, IP, NAT, DHCP, ICMP, Ethernet and ARP, 802.11 Wi-Fi, 5G and TLS.
These are not exercises for passing exams. Wireshark’s official documentation notes that network administrators use it to troubleshoot network problems, so the skill you practise at home is the tool you will open on the client’s machine.
A sensible order for an FDE is to read chapter 2 and do the HTTP and DNS labs, read chapter 3 and do the TCP lab, then jump to chapter 8 and the TLS lab. Skim chapter 1 for the overall framework, and read the remaining chapters when a project calls for them.
Three ideas to keep, and how to put them on your CV
Once the book is closed, three ideas are worth taking into the field. Debug from the top down, starting with the symptom the client can see. The book explains QUIC in both the application-layer and transport-layer chapters, so do not look for its faults in only one place. And observation with a packet sniffer always comes before guesswork.
As for your career, a line saying “knows networking” on a CV convinces no one. Capture a real API call from a personal project, work through the three filters above, write a one-page explanation of how long each step took, and add it to your portfolio.
When reading FDE job ads, look for descriptions that mention client network environments, VPCs or corporate proxies: that is where such an analysis will make you stand out.
The next time a client says “the API is slow”, you will not be guessing. You will open the packet capture and show them where the time goes.
Was this article useful?
Thanks for the feedback!