Run your eval five times before you report a score to the client
Even at temperature 0, rerunning the same eval can produce a different score. This guide shows how to measure that variation and give the client a score range with a statistical basis.

In brief
- Differences in hardware, batching and API behaviour can make the same input produce different outputs. A single eval run is therefore not enough to report a score.
- 200 questions run 5 times are not 1,000 independent observations. Average per question first and then compute the error, or resample whole clusters.
- When comparing two systems on the same questions, use paired differences. If the confidence interval of the difference contains zero, you cannot yet claim either side wins.
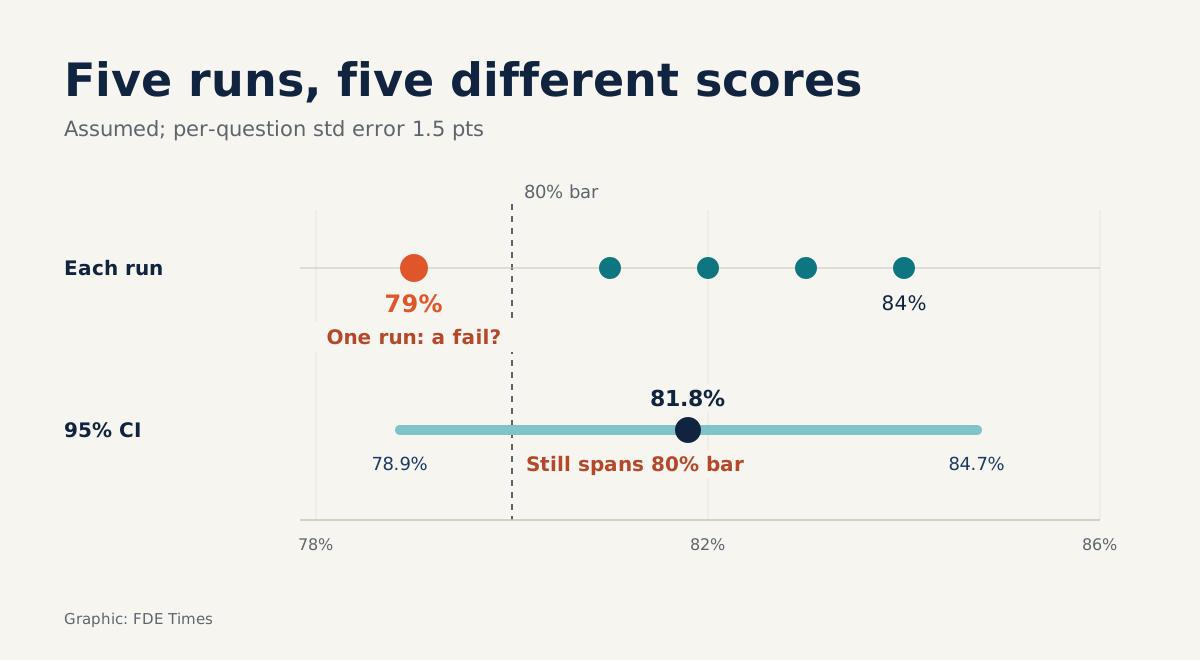
Imagine running a client’s 200-question eval five times in a row without changing a line of code. The five runs return 81%, 84%, 79%, 83% and 82%. Had you run it once and happened to land on 79%, you might have told the client the system “has not reached 80%”.
Those numbers are hypothetical, but the phenomenon is real. Engineers at Indeed note that even at temperature 0, differences in hardware, batching and API behaviour can still make the same input produce different outputs. A single run is one sample, not a measurement.
For an FDE, this is a matter of credibility. Clients decide whether to go live or buy more based on the number you report. This guide walks through six steps you can complete on a laptop in an afternoon: run the eval five times, measure the noise, then report the score with a confidence interval.
What you will build, and what you need
The end result is a plain Python script that uses only the standard library. It reads the repeated-run results and prints three things: the mean score with a 95% confidence interval, a confidence interval computed by cluster bootstrap, and the paired difference between the new model and the baseline.
You need an existing eval set, with each question scored 0 or 1 or on a continuous scale. You also need a function that calls your system and somewhere to store results as JSONL. The code below is a stripped-down version for illustration, so you will need to wire it into your real harness.
Steps 1–2: hold everything fixed, then repeat the runs
OneUptime recommends holding fixed everything that can be measured independently and repeating only the random part. In practice that means locking the prompt version, the dataset, the model version and the grader. If you change the grader between runs, you are measuring two things at once and can no longer isolate the noise.
Next, repeat the runs. Anthropic, in its statistical guidance for evals, recommends resampling answers from the same model several times to reduce variance. Indeed suggests k=3 or k=5 runs per input if the budget allows.
import json
# run_eval is your function: it calls the system, grades the answer, returns 0/1
with open("runs.jsonl", "w") as f:
    for run in range(5):
        for q in questions:
            score = run_eval(q)
            f.write(json.dumps({"qid": q["id"], "run": run, "score": score}) + "\n")
Check: the file must have exactly N × 5 lines, and each qid must appear exactly 5 times. Missing lines usually mean a timeout error was silently swallowed. Errors like this skew the score without anyone noticing.
Step 3: why 1,000 lines are not 1,000 observations
This is the most common mistake. According to Indeed, repeated-run data is structured as N independent inputs, each with k correlated runs. Five answers to the same hard question tend to be wrong together. Treat them as five independent observations and the confidence interval comes out narrower than it really is.
The simplest fix is to average per question first, then compute the error over those N means. Anthropic uses the 1.96 × SEM formula: add and subtract this quantity from the mean to get a 95% confidence interval.
import json, statistics
from collections import defaultdict

by_q = defaultdict(list)
for line in open("runs.jsonl"):
    r = json.loads(line)
    by_q[r["qid"]].append(r["score"])

q_means = [statistics.mean(v) for v in by_q.values()]
mean = statistics.mean(q_means)
sem = statistics.stdev(q_means) / len(q_means) ** 0.5
print(f"{mean:.3f}  CI95: {mean-1.96*sem:.3f} – {mean+1.96*sem:.3f}")
Back to the opening example. The mean of the five per-run scores is 81.8%. Because every question ran exactly 5 times, this matches the mean of the 200 per-question means that the script computes.
The 79–84% spread across runs and the SEM measure two different things. The spread tells you how much a single run fluctuates; the SEM tells you how certain the 81.8% mean itself is, given that 200 questions are only a sample of the countless questions the client might ask.
That is why the SEM is computed over the 200 per-question means, as in the sem line of the code, not over the 5 per-run scores. Suppose the SEM computed that way is 1.5 percentage points. Then 1.96 × 1.5 = 2.94, and the 95% confidence interval runs from 78.86% to 84.74%.
That is far more informative than a lone 79% or 84%. Where several questions share one passage, as in a reading-comprehension set with five questions on the same document, Anthropic recommends clustering by the unit of randomisation, for example by passage. In that case, group by passage_id instead of qid.
Step 4: cross-check with a cluster bootstrap
The 1.96 × SEM formula is an approximation. When the eval set is small or scores bunch up near 0% or 100%, cross-check with a bootstrap. Indeed tested five bootstrap strategies and found that resampling whole input clusters achieved the nominal coverage in simulation, without being needlessly wide like the others.
“Nominal coverage” here means that an interval labelled 95% actually contains the true value about 95% of the time. The function below takes by_q from step 3, the dict keyed by qid holding the list of scores across runs.
import random, statistics

def cluster_bootstrap(by_q, B=2000, seed=0):
    rng = random.Random(seed)
    keys = list(by_q)
    stats = []
    for _ in range(B):
        sample = [rng.choice(keys) for _ in keys]  # draw whole questions, with all 5 runs
        stats.append(statistics.mean(statistics.mean(by_q[k]) for k in sample))
    stats.sort()
    return stats[int(0.025 * B)], stats[int(0.975 * B)]
Check: the bootstrap interval should be close to the one from step 3. If the two differ substantially, revisit how you clustered before reporting to anyone.
Step 5: is the new model really better?
Clients rarely ask “what is the score?” They usually ask “is the new version better than the old one?” Anthropic points out that when comparing two models on the same set of questions, you remove the variance that comes from question difficulty.
What remains is only the variance of the answers. OneUptime likewise recommends paired differences, since both systems faced the same cases.
In the code below, cand and base are two dicts keyed by qid, each value a list of scores across runs, loaded from the result files of the new model and the baseline exactly as by_q was built in step 3.
diffs = [statistics.mean(cand[q]) - statistics.mean(base[q]) for q in base]
d = statistics.mean(diffs)
se = statistics.stdev(diffs) / len(diffs) ** 0.5
print(f"Δ = {d:.3f}  CI95: {d-1.96*se:.3f} – {d+1.96*se:.3f}")
Reading the result is simple. If the confidence interval contains zero, you have no evidence that the new version is better. What to tell the client is “we cannot yet tell them apart”. Do not say “up 1.2 points”.
Step 6: set thresholds afterwards, not beforehand
Many teams set a CI gate such as “block the release below 80%” from day one. OneUptime argues that thresholds should be set only after a variance study. In the example above, noise moves the score between 79% and 84%. An 80% threshold set before measuring the noise will block releases at random.
What if the confidence interval is still too wide? According to Indeed, extra runs per input reduce within-input noise and are usually cheaper, but the gains are limited.
Adding new inputs, by contrast, keeps narrowing the confidence interval. Anthropic also advises using power analysis to work out in advance how many questions you need. So writing more questions is worth more than a sixth run.
Common mistakes
The easiest mistake is computing the SEM over all N × k lines as if they were independent, which makes the confidence interval look more certain than it is. Next comes letting the grader, prompt or data change between runs.
Also common is comparing two models through two separate confidence intervals instead of paired differences. That throws away the advantage of both sides running on the same questions.
How this skill shows up with clients
In a client review, the number to report looks like this: “81.8%, 95% confidence interval 78.9% to 84.7%, on 200 questions × 5 runs”. That sentence tells the client how far to trust the number. It also heads off the situation where the score “drops” 3 points next week and you have to explain it was only noise.
If you are aiming for an FDE role, look for job descriptions that mention “evaluation”, “eval harness” or “model quality”. On your CV, do not just write “built an eval set”. A more specific line might be: “Ran a 200-question eval × 5 runs, reported scores with 95% confidence intervals and reset the release-blocking threshold based on measured noise.”
Anyone can run an eval. What clients remember is who reported a number that did not need correcting the following week.
Was this article useful?
Thanks for the feedback!