High RAG scores, disappointed users: read real traces before trusting the metrics
A green scorecard answers only the questions you thought to ask. The reasons customers are disappointed sit in the traces nobody has read.
In brief
- Neither public benchmarks nor high faithfulness scores guarantee that users are satisfied.
- The right starting point is reading real traces with a domain expert, then choosing metrics according to the failures you find.
- A metric deserves trust only once it has been checked against human scores and user behaviour on the customer's data.
Picture week six of a deployment. You open the customer review with a handsome scorecard: faithfulness 0.94, answer relevance 0.91. The head of operations hears you out, then says her staff have gone back to digging through document folders, just as they did before.
The scorecard is not wrong. It simply answers a different question. Anyscale’s documentation on RAG evaluation warns about both layers of the problem: high scores on public benchmarks do not guarantee that a system performs well on domain-specific production data, and perfect faithfulness and relevance scores do not guarantee that users are satisfied.
For an FDE, this gap decides whether a deployment lives or dies, because customers sign off on the basis of their work, not your dashboard.
Do not go looking for a single metric that predicts production quality. What you can do is start from real failures, choose a metric for each type, and then test each metric against human graders and user behaviour.
Why doesn’t faithfulness know a rule has expired?
Ragas, a framework published in 2023, is attractive because its evaluation needs no references, meaning no human-assigned labels. In your first weeks at a customer, you usually have no labels at all. It also separates quality into distinct dimensions: whether retrieval fetched the right material, whether the LLM used the context faithfully, and how good the generated answer is.
But read carefully the question faithfulness asks: does the answer stick to the context it was given? If that context is a superseded version of a rule, the answer can stick to it closely and still be wrong for the user. The metric is doing its job. That job just isn’t the customer’s.
Hamel Husain writes that unsuccessful AI products almost always share one root cause: a failure to build a robust evaluation system. His advice is equally concrete: examine traces and failure modes to find out what is actually broken. So the first step is not choosing a metric but reading the data.
A hundred traces say more than any scorecard
Take a hypothetical example, in which every number below is invented for illustration. A logistics company uses a RAG assistant so its customer service staff can look up compensation rules. You pull the 100 most recent real traces, sit down with their best agent, and for each trace record exactly two things: pass or fail, and why.
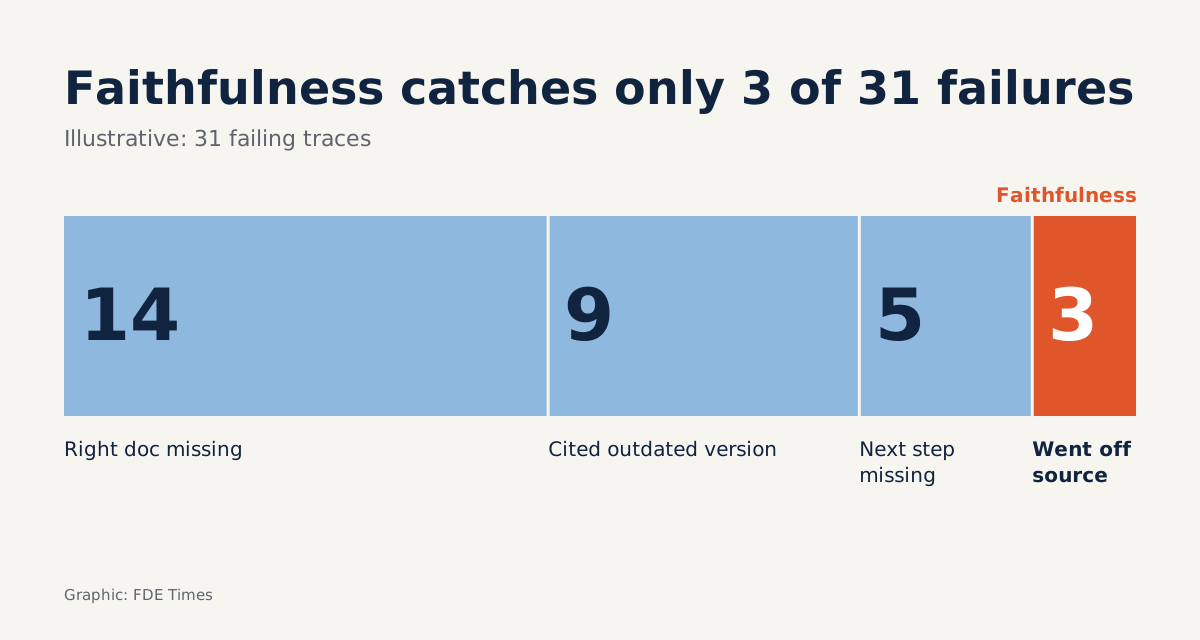
The result is 31 failing traces. Group the reasons and you get this table:
| Failure type | Traces | Does faithfulness catch it? | Suitable measure |
|---|---|---|---|
| Right document not in the top 20 | 14 | Usually not | 1 − recall@20 on a golden set |
| Cites a rule version that has expired | 9 | No | Stale citation rate |
| Correct but long, missing the next step | 5 | No | Grading against the expert’s criteria |
| Says something the documents do not contain | 3 | Yes | Faithfulness |
Only 3 of the 31 failures are the type faithfulness was built to catch. Meanwhile, 23 failures (14 plus 9) sit in retrieval and data, so a week spent tuning prompts would be a week wasted. This table is worth more than any average, because it shows what to do first.
Golden set: real questions, one metric per failure type
Anyscale advises creating your own test set that reflects the real use case, and the 100 traces you just read are the raw material. Take the 14 questions missing the right document and the 9 citing an old version, then add 27 that passed, to protect behaviour that already works, for a total of 50. A domain expert confirms the valid version for each question and marks the versions that have been superseded.
For retrieval, Anthropic chose a simple measure, 1 − recall@20: the failure rate within the top 20 chunks. Old rule versions need a separate measure, because one can sit in the top 20 beside the new version while recall still reports a pass. A few lines of Python are enough to run both:
def failure_at_k(golden, retrieve, k=20):
    """Return 1 - recall@k and the list of missed questions to reread."""
    recalls, misses = [], []
    for case in golden:
        top_ids = {c.doc_id for c in retrieve(case["query"])[:k]}
        expected = set(case["expected_doc_ids"])
        recall = len(top_ids & expected) / len(expected)
        recalls.append(recall)
        if recall < 1:
            misses.append(case["query"])
    return 1 - sum(recalls) / len(recalls), misses


def stale_citation_rate(golden, answer):
    """Return the share of answers citing an expired version and the list of those questions."""
    stale = []
    for case in golden:
        cited = set(answer(case["query"]).cited_doc_ids)
        if cited & set(case["stale_doc_ids"]):
            stale.append(case["query"])
    return len(stale) / len(golden), stale
Continuing the hypothetical: each question has one right document, and in all 9 questions citing an old version, the new version is still in the top 20. On the first run, 1 − recall@20 flags only 14 of the 50 questions, or 28%, and the other 9 slip through. Only the second function sees them: 9 of 50 questions, or 18%.
These numbers are not the system’s true failure rates, because the test set is deliberately packed with hard cases. They are useful only for comparing before and after.
Two types of failure need two fixes. You remove the old versions from the index, and questions citing an old version fall to 1, or 2%; that one question tells you some documents still lack correct version tags. You add reranking, and questions missing the top 20 fall to 8, or 16%. Then you keep reading the misses list.
Anthropic reports that its contextual retrieval method reduced failed retrievals by 49%, and by 67% when combined with reranking. Treat that as evidence that retrieval is worth investing in, not as a result you can promise a customer. In keeping with Anyscale’s warning, the figure has to be measured again on the customer’s data.
Automated metrics must pass a human test
A study posted on arXiv in July 2026 compared metrics from Ragas, DeepEval, RAGChecker and Opik with the scores of two human assessors and with standard measures such as recall. You should borrow that comparison in a shortened form for customer work. Fifty traces and one afternoon is the scale for you, not the study’s setup.
Two people grade independently, usually you and a domain expert. Then both sit down, go through the traces where their verdicts differ and settle them against the agreed criteria; if that still does not resolve one, the domain expert decides. Each trace now has a single shared verdict.
Now run the automated metric on the same 50 traces. The number to look at is how many traces the metric passes but the shared verdict fails. Suppose the metric passes 40 traces and 13 of those were failed: 32.5% of the traces it passed do not actually meet the bar.
You then have two options. Either adjust the threshold and rerun, or demote the metric to an alarm: run it daily on traffic to catch sudden drops, but do not use it as an acceptance criterion.
If the two graders themselves often disagree, the problem is that nobody has defined what a pass means, and that must be your next meeting.
Users are already grading, but nobody records it
Eugene Yan sees the user feedback loop, including implicit feedback, as the way to evaluate a system’s overall performance in production. With the assistant at that logistics company, thumbs-down clicks would be rare, so behaviour becomes the main source: asking again immediately after receiving an answer, opening the source document and still calling a colleague, moving to another support channel.
Do not assume every signal is right. Opening the source document may be suspicion, or it may be a responsible check before replying to a customer. So each week, sample the traces with bad signals and read them: signals that go together with traces graded as failures are the ones to keep as early indicators.
This loop survives only if reading traces is easy enough. Husain writes that you must remove all friction from the process of looking at data. If viewing one trace takes three tools and a SQL query, nobody will still be reading after week two.
The traps that turn evals into decoration
The most common trap is a golden set whose questions engineers invented themselves. Those questions tend to use the exact terminology of the documents, while real users abbreviate, make typos and ask in terms of their situation. A high score then shows only that the system answers well the questions its builders thought of.
The second trap is merging everything into one average, which lets a serious type of failure vanish behind hundreds of easy questions.
A wrong compensation amount has far heavier consequences than a slightly long answer, so report by failure type.
Customers also find it easier to act on “9 questions use the old rule” than on “the score fell by 0.03”.
The third trap is freezing the test set. Documents change, users change how they ask, and last month’s golden set gradually measures a system that no longer exists, so add new failure cases each time you read traces. The final trap is grading alone: you do not have enough domain knowledge to know where an answer sounds reasonable but is wrong.
How does this skill show when you apply for jobs?
When reading the job description for an AI-focused FDE role, look for words such as evals, error analysis and production feedback. In interviews, turn the question around: on what criteria does the team accept a RAG deployment, and who reads the traces? The answer tells you whether the job is real deployment or a prolonged demo.
On your CV, replace “built a RAG pipeline” with a sentence that has both process and result, using your own real numbers: how many traces you read with users, what types of failure you found, and from what level to what level you brought 1 − recall@20.
If you do not have a customer yet, work on a public document collection, ask someone outside the field to pose the questions, and publish the failure classification too.
This week’s exercise: take 30 real traces from the system you are working on, give each a provisional pass or fail, then ask a domain expert to confirm them. Next, count how many of the confirmed failures your current metric catches. If that number is low, you know which slide should open your next customer review.
Was this article useful?
Thanks for the feedback!
6 sources
- RAG evaluation
- Ragas: Automated Evaluation of Retrieval Augmented Generation · 2023-09-26
- Your AI Product Needs Evals · 2024-03-29
- Introducing Contextual Retrieval · 2024-09-19
- Evaluating RAG Metrics in Applied Contexts: An Experiment, Its Findings and Its Limitations · 2026-07-08
- Patterns for Building LLM-based Systems & Products