Explaining the LLM bill to a CFO: price each outcome, not each call
1.8 cents a call looks comfortable. Divide the bill by the work that actually got done and it becomes 7.5 cents.

In brief
- Cost per call is total spend divided by the number of calls. A CFO needs cost per outcome: total spend divided by the work actually completed.
- Caching, retries and reasoning tokens can push cost per outcome well away from the estimate on paper.
- Give the CFO three scenarios, each with its assumptions, then compare the forecast with actual spend every month.
Picture this: the pilot has been running smoothly for three weeks. Then an email arrives from the client’s finance team: “What is this month’s bill, what will next month’s be, and how much does each completed case cost us?” The account manager can’t answer it.
You have to, because only you know how many times the system calls the model, and for what.
This is where many FDEs miss a big opportunity. They send back a total token count or, worse, the provider’s public price list. The CFO needs three other things: the cost per outcome, a forecast, and the margin of error on that forecast.
This skill belongs to the value-measurement side of FDE work. Do it well and you turn an opaque cost line into unit economics the leadership team can make decisions with. If you want a contract renewed or a deployment expanded, you usually have to get through exactly this conversation.
It also earns a line on a CV: “built a cost-per-outcome model and reconciled monthly forecasts against actual spend with the client’s finance team” carries far more weight than “optimised tokens”.
Why does an LLM bill frustrate a CFO?
CFOs are used to reading cloud bills. Microsoft, writing about cost management for Azure OpenAI, points to the core difference: traditional cloud services charge by compute hour or by GB stored, while LLMs charge by the tokens consumed. A compute hour is easy to picture. A million tokens gives a CFO nothing to tie to the company’s actual work.
Harder still, the token count for the same task is not fixed. Microsoft also notes that usage spikes make forecasting more difficult.
For reasoning models, OpenAI’s documentation says reasoning tokens are not visible through the API but are still billed, and that in some cases you pay for input and reasoning tokens without receiving any visible answer.
So don’t make the CFO learn about tokens. Your job is to convert tokens into units they already understand: a case processed, a ticket closed, a contract reviewed.
Divide by calls or by completed work?
Finout, a company that builds FinOps tools, separates two metrics. Cost per inference is total AI spend divided by the number of model calls.
Cost per outcome takes allocated AI spend and divides it by the number of outcomes. The first metric counts a failed call the same as one that finished the job; the second counts only work that actually got done. Failed work still costs money, so its cost stays in the numerator; it simply isn’t counted in the denominator.
For the numerator, CloudNuro, a vendor of cost-management tools, gives a per-transaction formula: tokens per call multiplied by the token price, plus calls per transaction multiplied by the per-call fee.
On top of this formula you add two layers the bill doesn’t show: retries and failures. CloudNuro recommends tracking success, failure and retry rates separately. Every retried call pushes up the cost per outcome.
Costing an insurance claim from tokens to cents
Imagine an agent that triages insurance claims. Each claim needs 3 calls: extraction, classification and drafting a response.
Each call has 6,000 input tokens, of which 5,000 are a repeated system prompt and instructions that can be cached, plus 800 output tokens.
The prices below are assumptions chosen to keep the arithmetic simple: input at USD 3 per million tokens, output at USD 15 per million tokens.
Anthropic’s prompt caching documentation gives two multipliers you need to know. Cache reads cost 0.1 times the base input price (with exceptions for some models). Cache writes with a 5-minute TTL cost 1.25 times, and 2 times with a 1-hour TTL.
At the assumed prices, an uncached call costs USD 0.030. A cache hit costs USD 0.0165. A call that has to write the cache costs USD 0.03375, more than an uncached call.
Suppose a month brings 10,000 claims, 10% of calls need a retry and 90% of calls hit the cache. That is 33,000 calls in total: 29,700 cache hits costing USD 490.05 and 3,300 cache writes costing USD 111.375, about USD 601.43 altogether.
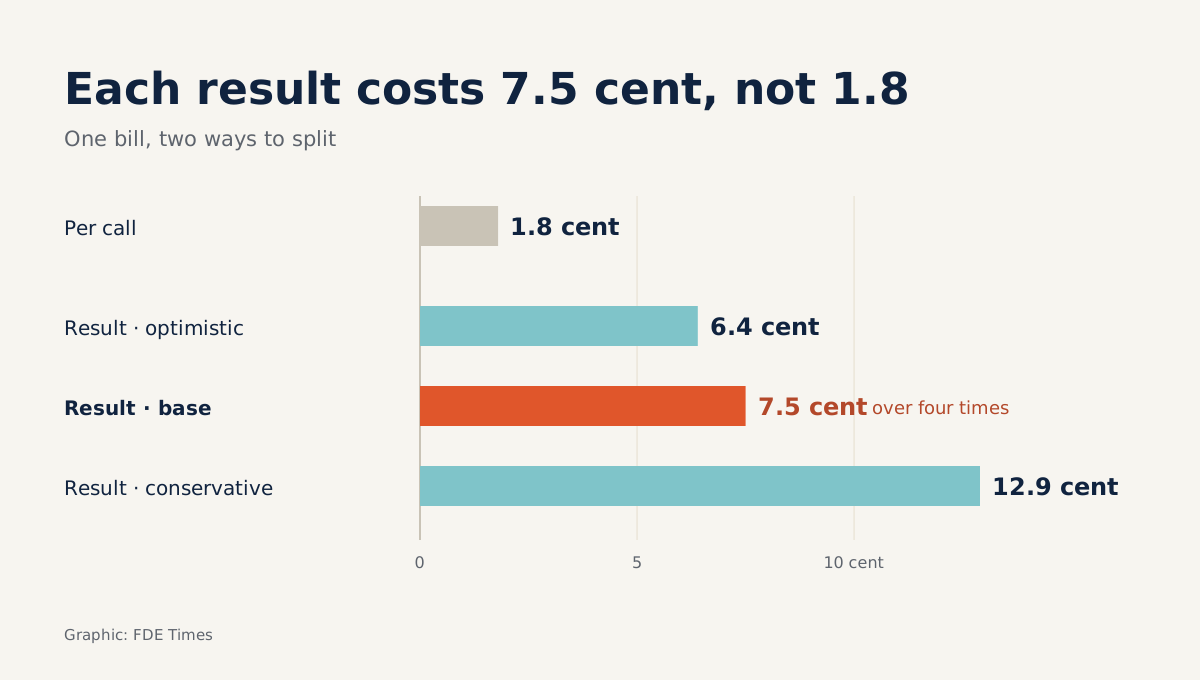
Divided by the number of calls, that comes to about 1.8 cents a call. It looks good, but it is no use to a CFO.
Now suppose only 80% of claims, or 8,000, are fully processed without human intervention. The other 2,000 still ran all their calls, so their cost is still inside the USD 601.43, but they don’t count as outcomes.
The cost per outcome is 601.43 divided by 8,000, about 7.5 cents. That is more than four times the cost per call, and it is the number a CFO can compare directly with the labour cost of handling one claim.
Which assumptions hold the margin of error?
CloudNuro recommends modelling several scenarios: conservative, base and optimistic. Each scenario has to rest on a specific assumption; otherwise it is just a guess. In the example above, the three variables that move the result most are the cache-hit rate, the retry rate and the success rate.
| Scenario | Cache hit | Retry | Success | Monthly spend | Cost per outcome |
|---|---|---|---|---|---|
| Conservative | 50% | 20% | 70% | ~USD 904.50 | ~12.9 cents |
| Base | 90% | 10% | 80% | ~USD 601.43 | ~7.5 cents |
| Optimistic | 95% | 5% | 85% | ~USD 546.92 | ~6.4 cents |
The cache-hit rate is the variable most easily misjudged. According to Anthropic, the cache lives for 5 minutes by default and is refreshed at no charge each time it is used. During the day claims arrive continuously, so the cache stays warm.
At night, if a claim arrives only every ten minutes, the cache has expired before the next one comes in. Assuming the three steps of a claim share the same cached prefix and run back to back, the first call for each claim has to rewrite the cache at 1.25 times the price, and only the next two hit it.
The night-time cache-hit rate therefore drops to about 67%, well below the 90% in the base scenario. If each step uses its own prompt, all three calls have to write the cache. The rate you measured during load testing may be far higher than reality.
Reasoning tokens widen the margin further. OpenAI advises reserving at least 25,000 tokens for reasoning and output when you first start experimenting.
At the assumed output price above, a call that hits this limit costs USD 0.375, more than 20 times the average cost per call in the base scenario.
If the workflow uses a reasoning model, record a per-call cost ceiling as a separate assumption in the table.
Common mistakes
The most common mistake is reporting cost per call and letting the CFO assume it is the cost per job. When they divide the bill by the number of claims themselves, you lose credibility on the spot. The second is taking the cache-hit rate from a dev environment, where requests arrive densely, and applying it to production, where traffic thins out at night.
The third is forgetting the cache-write surcharge and assuming every call gets the 0.1 price. The fourth is lumping failures and retries into a single figure, so you can’t tell whether costs rose because the model is weak or because the pipeline is broken. The last is offering a single forecast number with no scenarios attached.
How to put it to the CFO
The opening line should be: “Each completed claim currently costs about 7.5 cents, and in a bad case it could rise to about 12.9 cents.” The next line says which variable pushes the cost to the bad case and how you are tracking it. Tokens belong only in the appendix.
CloudNuro’s blog states that organisations spend on average 17% more on consumption-based AI services than their original budgets. This is a vendor’s figure and should be treated only as a reference point, but it shows that a budget without a contingency margin is easily overrun.
So before leaving the meeting, agree a reconciliation cadence. CloudNuro writes that forecasts are only reliable when regularly compared with actuals, and suggests reviewing forecast against actual spend once a month.
The first forecast will almost certainly be off. What the CFO remembers is that you came back the following month with the actual spend, showed which assumption was wrong and how the scenario table had been revised.
Was this article useful?
Thanks for the feedback!