An integration that runs for an hour, then hangs: finding the fault in the connection pool, timeouts and queues
When a failure recurs almost exactly every hour, the culprit is usually not in your code but on the client's network path. Bigger pools and extra retries only make it worse.

In brief
- A firewall or NAT can drop an idle connection, for example after 60 minutes, without sending a TCP close. The pool still believes the connection is alive.
- Set the connection TTL below the shortest idle timeout on the path and turn on background cleanup. Do not increase the pool size.
- Retry in a single layer, with jitter. For queues, measure message age, not just length.
The demo runs smoothly all morning. After lunch, the system sometimes sits idle for about an hour, then the first request hangs until it times out, dragging a few dozen others down with it. You restart the service and everything works again, right up to the next hang.
The reason becomes clear when you compare the two environments. On your laptop there is no device between the application and the database. At the client’s company there is a firewall, a NAT gateway and a load balancer, each with its own rules that nobody wrote into the integration documentation.
This article shows how to read the incident in three layers: connections, timeouts and retries, then queues. The most common reflex at all three layers is to enlarge the pool, add retries and add workers, and all three reflexes make the incident worse.
Dead connections the pool still thinks are alive
The Nais infrastructure documentation describes the mechanism clearly. Stateful firewalls, NAT gateways and load balancers all delete entries that have been idle too long, and usually send no TCP close signal. Nobody on your side knows the connection is gone. The connection pool still treats it as healthy and hands it to the next request.
The concrete example in that documentation is a firewall that drops connections after 60 minutes of idle time without sending a close signal. That is why the failure tends to appear “after about an hour”, and usually during off-peak hours, when some connections in the pool go unused for long enough.
Nais recommends setting the maximum lifetime (TTL) of each pooled connection below the shortest idle timeout on the network path, and turning on background connection cleanup. The key word is “shortest”. If the load balancer cuts after 60 minutes but an internal firewall cuts earlier, the firewall’s number is the one you must follow.
Example: syncing orders into a client’s ERP
Imagine you write a service that pushes orders into the database of the client’s ERP system. During the day orders arrive constantly. From 10pm to 6am there are almost none. Every morning the first order hangs for about 30 seconds, then the next batch of orders fails too.
The way to investigate is to ask the client’s network team a specific question: “What devices sit on the path from our subnet to the ERP database, and what is the idle timeout of each one?” Suppose they answer that the firewall cuts after 60 minutes. The pool configuration (for example with HikariCP) would then look like this:
# shortest idle timeout on the network path: 60 minutes (the client's firewall)
maximumPoolSize=9
# TTL of 50 minutes, shorter than 60 minutes, with a safety margin
maxLifetime=3000000
# periodically check idle connections before the firewall can cut them
keepaliveTime=300000
The 50-minute figure is a deliberate choice: short enough that connections are always replaced before the firewall cuts them, long enough that the pool does not have to open new connections constantly. Record the source of the 60-minute figure in the handover runbook, because whoever takes over will not know where it came from.
Enlarging the pool makes the incident worse
When the system hangs, many people’s first reflex is to raise maximumPoolSize from 10 to 100. The HikariCP wiki says the opposite: for the best throughput, the number of active connections should be around (core count × 2) + number of effective disks.
A database running on a 4-core machine with one disk gives (4 × 2) + 1 = 9 connections, which is why the configuration above uses 9.
The reason is context switching. The wiki states that once the number of threads exceeds the number of CPU cores, adding threads only slows the system down. A pool of 100 connections does not make dead connections disappear. It only creates more connections that can die, and piles more load onto the client’s database just when the database is struggling.
Three layers of retries become nine calls
The second layer is timeouts and retries. The Amazon Builders’ Library points out that timeouts set too low increase load and latency on the backend, because too many requests are retried. Timeouts set too high let a dead connection hold a request for a very long time. Measure the real latency of the client’s system before choosing a number.
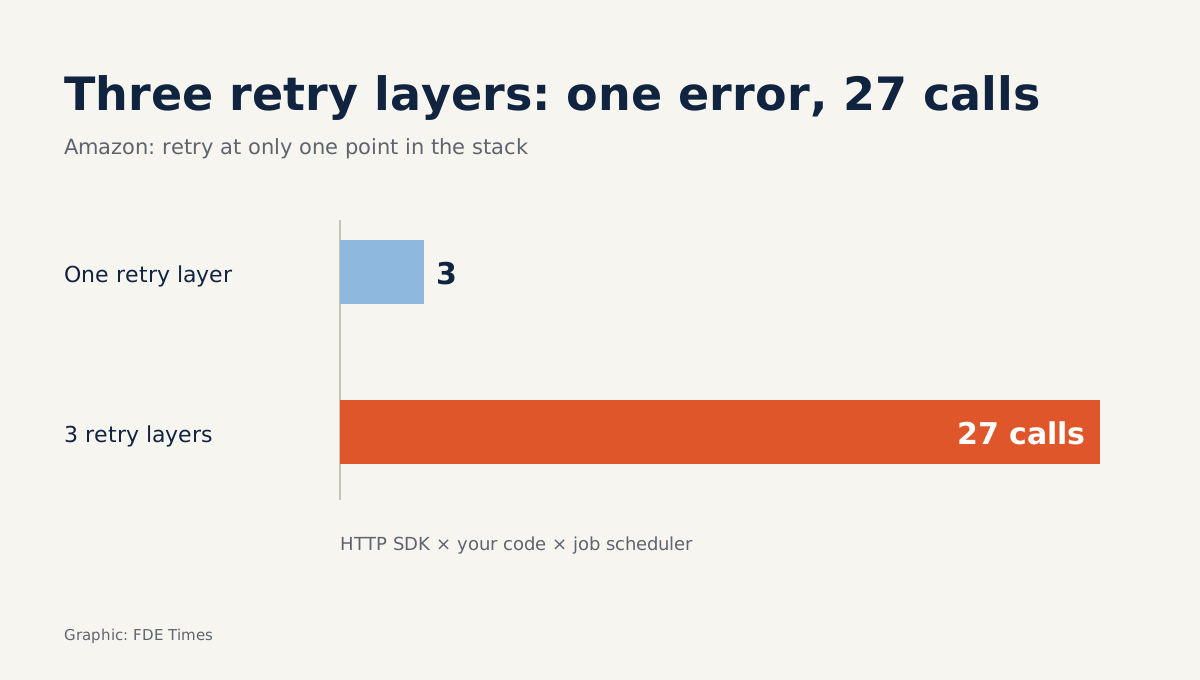
More dangerous still is retrying in several stacked layers. According to Amazon, retries at each layer multiply: three attempts become nine, and it keeps growing from there.
Suppose the HTTP SDK retries 3 times, your code wraps it with another 3, and the job scheduler reruns the job 3 times. One failed request can turn into 27 calls against a system that is already weak.
Amazon recommends retrying at a single point in the stack.
In the layer you keep, add jitter. Jitter adds a random amount to the backoff so that retries spread out over time, and clients do not hit the client’s system in synchronised waves.
import random, time

def call_with_retry(fn, attempts=3, base=0.5, cap=8.0):
    for i in range(attempts):
        try:
            return fn()
        except TransientError:
            if i == attempts - 1:
                raise
            # full jitter: wait a random time between 0 and the current backoff level
            time.sleep(random.uniform(0, min(cap, base * 2 ** i)))
Once retries live here, turn off the automatic retries of the SDK below and of the scheduler above.
Queues: measure age, not just length
The final layer is the queue, which explains why the client keeps complaining after you have fixed the pool. Amazon notes that once a backlog has formed, a system can take a very long time to work through it and return to a fast state. The root fault ends at 9am, but orders still reach the ERP late until close to noon.
That is why Amazon focuses on measuring the age of messages in the queue, not just its length. A queue holding 5,000 messages whose oldest message has waited only a few seconds is healthy. A queue holding 200 messages whose oldest has sat there for 40 minutes is a sign that the system is slow, or failing and retrying over and over.
Amazon also says that under overload, many of its systems automatically tighten up and reject more requests at the producer, rather than letting the queue swell.
For your integration, this means returning a clear error to the sender when message age crosses a threshold. That is better than quietly accepting more work and processing it hours late.
Common mistakes
The first mistake is fixing the problem with scheduled restarts. This masks the symptom, and whoever takes over will never understand why there is a cron job restarting the service at 3am. The second is asking for the idle timeout of only one device, when the number you need is the shortest timeout along the whole path.
The third mistake is leaving retries alive in every layer because each library enables them by default. The fourth is alerting on queue length, which swings with peak hours, instead of on message age.
If you have ever untangled an incident like this, put it on your CV with numbers rather than adjectives, for example: “identified a firewall dropping idle connections after 60 minutes, set the pool TTL to 50 minutes, removed duplicate retries across three layers”.
A “one-hour” incident rarely stems from a single wrong line of code. Most of the time it comes from a network device you have not asked about, so the first question on a client site should be: what sits between these two systems?
Was this article useful?
Thanks for the feedback!