Storytelling with Data: before you draw a chart, ask who makes the decision
A pilot that runs well can still fail at the final readout. Cole Nussbaumer Knaflic's 2015 book teaches how to build charts so that does not happen.
In brief
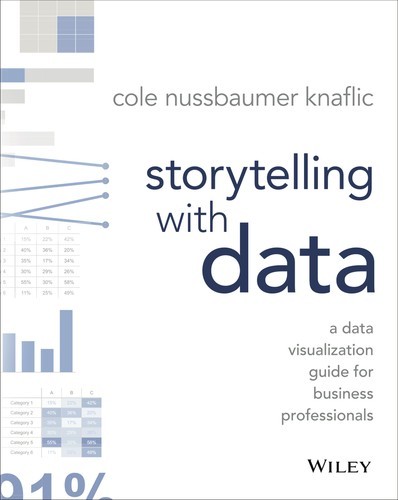
- Storytelling with Data (Wiley, 2015) is the first book by Cole Nussbaumer Knaflic, a former manager on Google's People Analytics team.
- The book works step by step, from choosing a chart type to using colour and adding annotations like a designer.
- For FDEs, the greatest value lies in the first step: knowing who the audience is and what you need them to know or do.
Imagine you have just finished a six-week pilot of a ticket-triage agent for a customer. You have all the data: accuracy, handling time, the number of tickets that went through the agent. Ahead of you are 30 minutes with a vice-president who has never opened the dashboard, and that person will decide whether to scale up or stop.
The easiest route is to paste ten charts exported straight from a notebook into a slide deck. Cole Nussbaumer Knaflic wrote an entire book to stop that reflex. Wiley introduces Storytelling with Data with a single call to action: don’t simply show data, tell a story with it.
For an FDE, this is not a decorative skill. When the decision to expand or stop rests on a meeting like that, what the customer sees in those 30 minutes is, in effect, the result you delivered.
Who wrote it, and why trust her?
The full title is Storytelling with Data: A Data Visualization Guide for Business Professionals. Wiley released the ebook in October 2015 and the print edition in November 2015. It was Knaflic’s first book, published five years after she started her company, storytelling with data, in 2010.
Before that, according to her profile at Chicago Booth, Knaflic held analytical roles in banking and private equity, then became a manager on Google’s People Analytics team. In other words, she writes from the side of the person who has to bring numbers in front of decision-makers, which is exactly where an FDE stands at a pilot readout.
The author’s website says the book is aimed at business professionals who want to impress and persuade others with charts. It says nothing about FDEs. But your customers do not need pretty charts either. They need to know what to do next.
One process, in small steps
According to the author’s website, the lessons follow a process: from choosing a chart type through to thinking like a designer when using colour and adding annotations.
A review of the companion workbook, Storytelling with Data: Let’s Practice!, in the journal Information Research notes that each step is broken into smaller ones that walk the reader through the whole process.
Wiley’s launch announcement places the starting point at understanding the context and the audience, then using story to make the message resonate. Knaflic puts it more plainly at Chicago Booth: start with the audience, decide what you need them to know or do, and think about who they are and what motivates them.
The same review of Let’s Practice! points out two limits: the book assumes the data is already prepared, and it is fairly light on theory. For FDEs the first limit matters most, because cleaning logs, joining tables and defining metrics at the customer’s site are still your job before this process begins.
Write one sentence before you open a charting tool
One summary of the book advises spending time up front thinking about context, the core message and the storyline. Back to the pilot example: the simplest way to apply this is to wrap the message in a single sentence.
Instead of the title “Pilot results, weeks 1–6”, write a sentence such as “The agent now handles simple tickets reliably, so we should expand to two more support teams next quarter”. That sentence forces you to choose. Any chart that does not help prove it goes to the appendix.
The storyline arranges the rest in order: the problem, the results, the remaining risks, the recommendation. In a 2019 podcast, Knaflic advised working out what the audience needs to know first so they are in the right frame of mind. For the vice-president, that might be how costly the original problem was.
Cut the clutter, then direct the eye
The summary defines clutter as anything that takes up space without adding to the viewer’s understanding. Picture a line chart with five data series, each in a different colour: the viewer has to solve a puzzle before grasping what you mean.
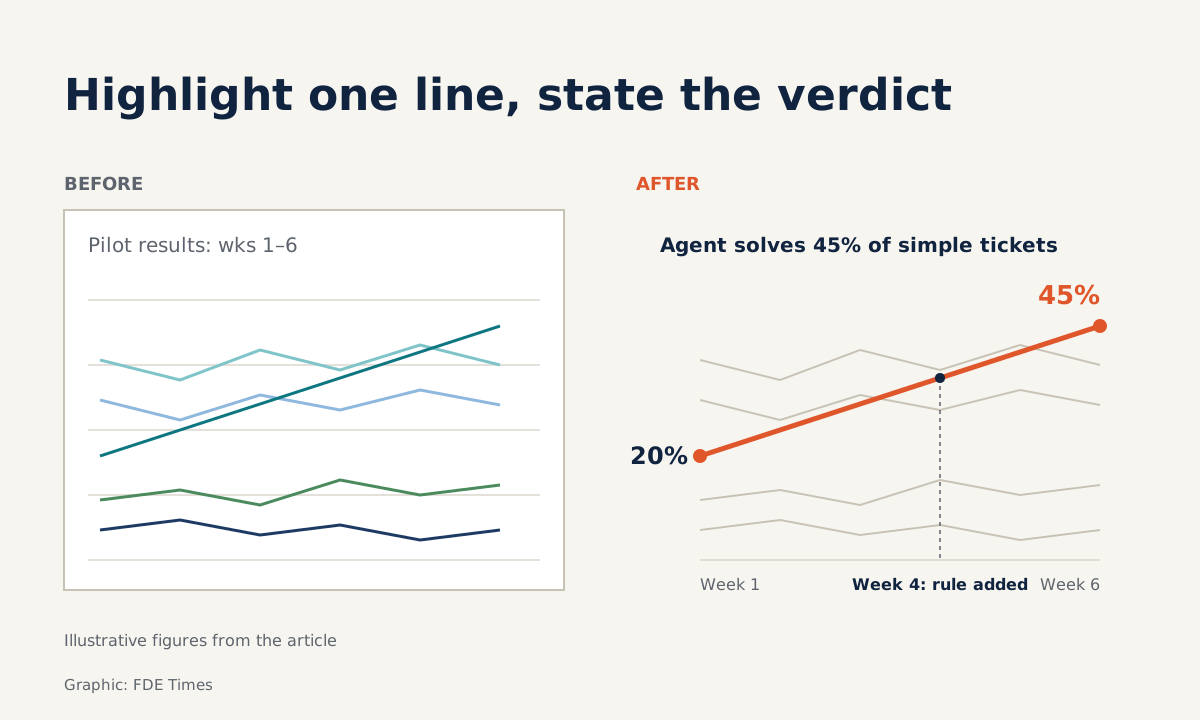
Now redo it with hypothetical numbers. Suppose the share of simple tickets the agent resolves on its own rises from 20% in week 1 to 45% in week 6.
One way to apply the book’s ideas is to turn the other four series grey, delete the gridlines and borders, colour only this series, and change the title into the conclusion: “The agent resolved 45% of simple tickets on its own in week 6, more than double week 1”.
Then put a one-line annotation right next to the inflection point, for example “Week 4: added a rule for password-reset tickets”, rather than leaving the explanation in a footnote. The viewer reads the title, sees the coloured line, finds the reason, and has enough to nod or ask a follow-up. This needs no new tool, only the nerve to delete.
Whose language are you speaking?
Knaflic’s advice to build the presentation around the audience’s needs has a very practical consequence for FDEs: use the customer’s terms and units, not your team’s. If the customer’s operations team measures in “handling hours per shift”, do not make them read an F1 score.
This is where the book connects directly to customer discovery. You only know what motivates the audience if you asked them at the start of the engagement, so write down how the customer measures their own work from the very first meeting.
Before sending the slides, check three things: is there a message sentence, is the title a conclusion or merely a description such as “Self-resolution rate by week”, and whose units are these? All three can be fixed in an afternoon.
Who should read it, and in what order?
The book suits any engineer who regularly presents results to non-technical people. Read the original first, then work through the companion Storytelling with Data: Let’s Practice!. The Information Research reviewer recommends the workbook to the library and information community, while noting that its focus leans towards business and marketing.
If you are moving into an FDE role, add a “before and after” pair to your portfolio: the original chart, the redesign, and the message sentence. In interviews, describe the decision the chart helped its audience make.
Next time you prepare a pilot readout, write the message sentence before drawing the first chart. If you cannot write that sentence yet, you probably do not yet know what the customer needs to decide.
Was this article useful?
Thanks for the feedback!
8 sources
- Storytelling with Data: A Data Visualization Guide for Business Professionals | Wiley · 2015-11
- A Data Visualization Guide for Business Professionals (Wiley press release) · 2015-11-09
- Books | storytelling with data
- Book Summary – Storytelling with Data: A Data Visualization Guide for Business Professionals
- Review of Storytelling with data: let's practice (Information Research, R709)
- Storytelling with Data (Chicago Booth CareerCast) · 2016-05-20
- My Quest for the Best with Bill Ringle: Cole Nussbaumer Knaflic (Episode 240) · 2019-12-30
- Meet the team | storytelling with data