How to Measure Anything: the book that helps FDEs measure what clients call "intangible"
When a client says a project's value "can't be measured", Douglas Hubbard's book shows how to turn that claim into a numerical range, sometimes from just five samples.
In brief
- Hubbard defines measurement as reducing uncertainty, not finding an exact number, so anything that matters can be measured
- The variable most worth measuring is often one the client has never measured; the ones they measure most often have information value close to zero
- With 5 random samples, there is a 93.75% chance the population median lies between the smallest and largest value
Picture the third meeting on the client side. You have just deployed an agent to support the customer service team, and the head of operations says: “Everyone can see it helps, but that’s not something you can measure.” If you nod and move on, whether the project is renewed or cut will rest on one person’s gut feeling.
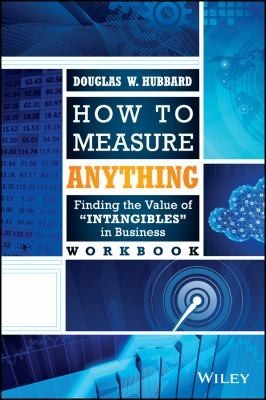
Douglas W. Hubbard wrote an entire book to refute that claim. How to Measure Anything: Finding the Value of Intangibles in Business first appeared on 3 August 2007. The third edition was published in hardcover by Wiley in March 2014, at 432 pages, and according to Hubbard Research, the author’s company, the three editions have sold more than 100,000 copies.
For an FDE, this is not a statistics book to read for general interest. It trains the skill most needed at the hardest stage of an engagement: proving value in numbers when the client believes the things they care about, such as customer satisfaction, technology risk or technology ROI, are “intangible”.
“Can’t be measured” usually means a misunderstanding of “measure”
Wiley summarises the book’s argument this way: the sense that something “can’t be measured” stems from a few common misconceptions about measurement. Set against Hubbard’s definition, one common misconception is that measuring must produce an exact number.
Hubbard defines it differently: measurement is a quantitatively expressed reduction of uncertainty based on one or more observations.
That definition changes the whole meeting. You do not need to know exactly how many minutes the agent saves, only to know more than you did yesterday. The tool for getting from an “intangible” goal to something measurable is the clarification chain.
If something really matters, it must be detectable or observable. If it is detectable as a range of possible values, it is measurable.
Applied to the meeting above, ask the head of operations: “If the agent really helps, what would you see change?” The answer is usually very concrete: staff spend less time per ticket, fewer tickets are escalated to second line, new hires handle tickets on their own sooner. Each answer is something observable, and therefore measurable.
Good estimation is a skill you have to practise
With a list of signals in hand, the next step is to give each one an honest range estimate. Untrained people are usually overconfident: the 90% confidence intervals they give contain the true value only about 50% of the time. Fortunately, according to the book, calibration is a teachable skill, and the improvement is measurable.
The skill pays off straight away in interviews. Asked “how much value did this project deliver?” in an FDE interview round, a 90% range plus how you would narrow it is far more convincing than a wild guess.
On a CV, instead of writing “improved performance”, state what you measured, with how many samples, and which decision the result led to.
Measure what the client has never measured
A range estimate tells you where you are in the dark, but not what to measure first. That is the job of information value. In a business case, most variables have an information value close to zero; according to Hubbard, a measurement is only worth making when high uncertainty comes with a high cost of being wrong.
Analysing IT business cases, Hubbard also found a paradox he calls the measurement inversion. The variables with high information value are often the ones the client has never measured.
Robin Hanson, quoting it on the Overcoming Bias blog, stressed the other half: the variables that take the most time to measure often have very low, even zero, information value.
Back to the support agent example, here are three hypothetical variables scored against Hubbard’s two criteria:
| Variable | Uncertainty | Cost of being wrong |
|---|---|---|
| Tickets per day | Low, the helpdesk already counts them | Low, does not decide renewal |
| Post-ticket satisfaction score | Medium, a survey already exists | Low, changes little month to month |
| Minutes saved per ticket | High, nobody has measured it | High, renewal depends on it |
The first two are what the client tracks most closely, yet knowing them more precisely would not change any decision. The third is both unclear and expensive to get wrong, so measure it first.
So do not accept the client’s KPI set as given. Before building a dashboard, draw up a table like the one above for the variables that decide renewal.
Five samples are enough to start
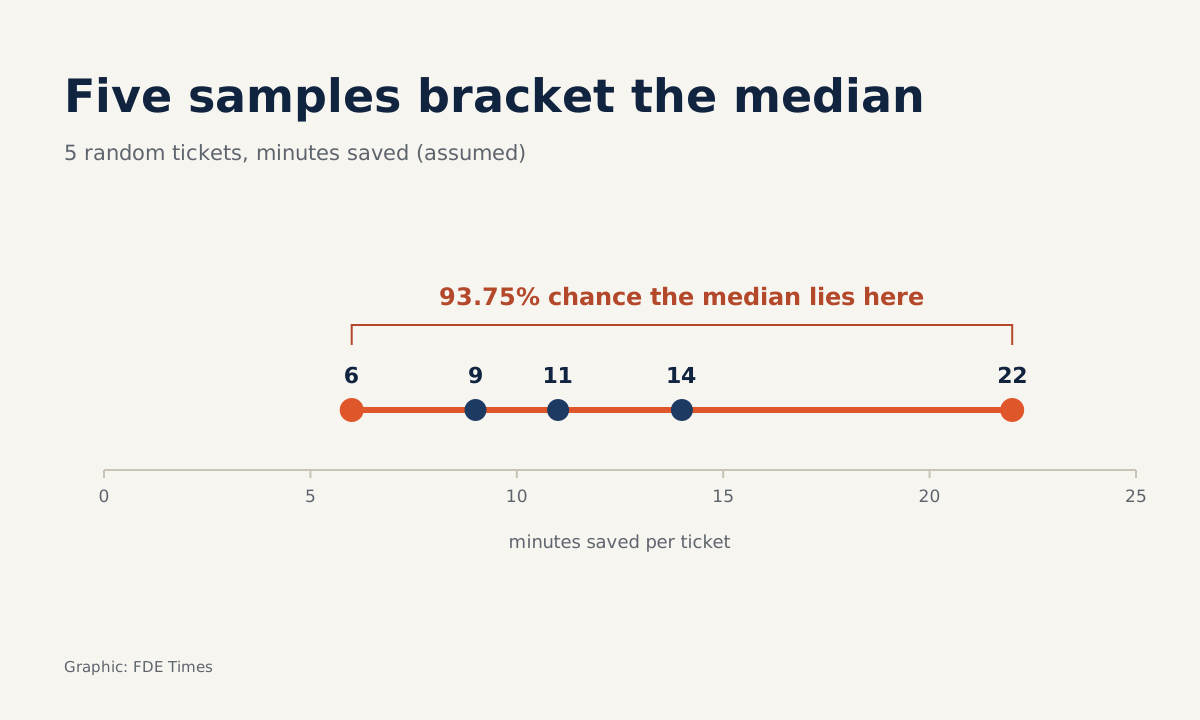
Once you have chosen the variable, you still do not need a large measurement system. Under the Rule of Five, if you draw 5 random samples from a population, there is a 93.75% chance that the population median lies between the smallest and largest of those 5 values.
The reasoning is simple: the probability that all 5 samples fall on the same side of the median is only 1/16.
Try it with some hypothetical numbers. You randomly draw 5 tickets handled with the agent’s help, measure how much time each saved, and get 6, 9, 11, 14 and 22 minutes. With no dashboard and no data pipeline, you already have fairly solid grounds to say the median minutes saved lies between 6 and 22.
One caveat: the rule only guarantees something about the sampling, it cannot correct bias in the individual numbers. If you ask staff to estimate the minutes saved themselves, their answers can easily skew with how they feel about the tool.
Where possible, time a few tickets directly with and without the agent, or pull ticket open and close times from the helpdesk.
The resulting range is still wide, but if nobody in the room dared to offer any number before, uncertainty has clearly fallen. The lesson for FDEs is that the first measurement should be cheap and quick, done in an afternoon, before proposing an instrumentation system that eats a whole sprint.
Who should read it, and in what order
The book suits FDEs who have to prove ROI to clients best, along with software engineers who want to move into the role. If you are preparing to switch jobs, take one of your past projects and work through all four steps above as a portfolio write-up.
The suggested order below follows the thread of this article, not the order of the book’s chapters. Get the definition of measurement and the clarification chain first, because they immediately change how you talk to clients. Then practise calibration, then use information value to choose variables, and finally the Rule of Five to measure quickly.
Next time a client says “that can’t be measured”, do not argue. Ask: “If it improved, what would you see?”, then go and take five samples.
Was this article useful?
Thanks for the feedback!
7 sources
- How to Measure Anything: Finding the Value of Intangibles in Business, 3rd Edition (Wiley)
- How to Measure Anything (Hubbard Research)
- 'How to Measure Anything' by Douglas W. Hubbard (Yevgeniy Brikman) · 2015-01-20
- The Cybersecurity Canon - How to Measure Anything: Finding the Value of 'Intangibles' in Business · 2017-07-19
- 94% confidence with 5 measurements (skeptric) · 2020-03-18
- How to Measure Anything (lukeprog, LessWrong) · 2013-08-07
- Missing Measurements (Robin Hanson, Overcoming Bias) · 2013-08-03