ISLP for FDEs: which chapters to read first and which can wait
The first time a client asks whether "this 92% figure can be trusted", these classic statistics chapters will matter more than any new framework.

In brief
- ISLP is the 2023 Python edition of a textbook first published in 2013: broad and light on maths, suited to practitioners.
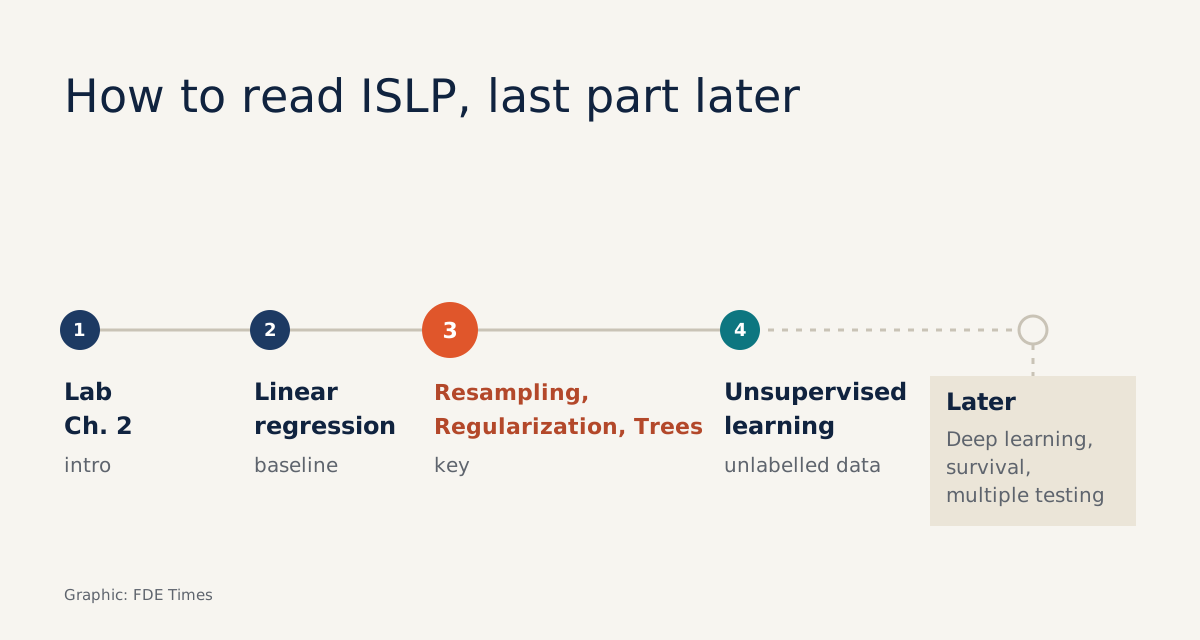
- FDEs should read in this order: the introductory lab, linear regression, resampling, regularization, decision trees, then unsupervised learning.
- Deep learning, survival analysis and multiple testing sit at the end of the book; leave them until a project actually needs them.
Machine learning books usually age within a few years. An Introduction to Statistical Learning has done the opposite: the first edition appeared in 2013, a second R edition in 2021, and in 2023 the authors added a Python edition, ISLP.
After ten years and three editions, the authors still considered the book worth rewriting for a new language. That alone says a good deal about how durable its content is.
For a Forward Deployed Engineer, the core of the book is the most neglected skill of all: judging honestly whether a model works on a client’s data. Agents, RAG and LLM evals all rest, in the end, on statistical questions this book posed long ago.
So the question worth answering is not whether to read ISLP. It is which chapters to read first so that next week you can use them on a project.
A book for people who build, not people who prove
On the official site, statlearning.com, the authors describe the book as a broad and less technical treatment of the key topics in statistical learning. In other words, it does not ask you to prove theorems. It wants you to understand why a method works and when it breaks.
What makes ISLP a good fit for FDEs is the lab at the end of each chapter, where the chapter’s concepts are run as Python code. The book comes with the ISLP library, and according to the documentation at islp.readthedocs.io there are labs for chapters 2 to 13.
The official GitHub repo, intro-stat-learning/ISLP_labs, keeps the labs in step with the library’s source code. Its stated aim is that setting up a virtual environment from requirements.txt should be enough to reproduce the results.
For an FDE, that reproducibility has very practical value. A reproducible notebook is something you can open in a client meeting, rather than recounting what you remember from the book. The Python edition can be bought from Springer, and the official site also links to a PDF download.
What order should you read it in?
Start with the introductory lab in chapter 2. The repo says to run it with uv run jupyter lab Ch02-statlearn-lab.ipynb. Next comes linear regression, because it is the baseline you will build first on almost every tabular-data project.
Then go straight to the three topic groups the official site lists and that FDEs need most: resampling (cross-validation and the bootstrap), regularization, and tree-based methods. Unsupervised learning comes right after, because the first week of a project is often when you are exploring unlabelled data.
The chapters the Python edition adds on deep learning, survival analysis and multiple testing sit at the end of the book. Leave them for later. Survival analysis is worth reading when a client asks “how long until customers churn” or “how long until the machine fails”. Multiple testing is worth reading when you start running dozens of experiments at once.
Lesson one: a score measured on the training set is a score that lies
Imagine a client sends 1,000 rows of data along with a model that the previous vendor reported at 92% accuracy.
If that figure was scored on the same data used to train the model, it tells you almost nothing. 5-fold cross-validation splits the 1,000 rows into 5 parts of 200 rows each.
In each round, the model learns on 800 rows and is scored on 200 rows it has never seen.
If the average drops to around 70%, you have just found the project’s real problem before it becomes a production incident. The bootstrap, the other half of the resampling group, gives you a range around that figure. Presenting such a range to the leadership team is far more honest than a single number.
Lesson two: extra variables are not free
Client data often has hundreds of columns: store codes, data-entry dates, every one of them apparently useful. Regularization teaches you to penalise overly complex models so they do not memorise the noise in the data.
When you receive a table like that, the first thing to do is compare the full model with a regularized one, both scored with cross-validation. If the simpler version matches or beats the full one, you have a model that is easier to explain and a leaner data pipeline to operate.
Lesson three: decision trees are a baseline clients can read
Tree-based methods are often seen as old-fashioned, but for an FDE they are a tool for talking to clients. A shallow tree can be printed as something like “if the order is above threshold X and the customer is new, risk is high”.
The client’s operators can read that sentence and push back if they think it is wrong, and the moment they push back is the moment you learn about the business.
The advice: build a simple tree first, show it to the domain experts, and only then consider more complex models.
When does cross-validation give the wrong number too?
Cross-validation is only honest when used correctly. The most common mistake is tuning parameters on the folds and then reporting the score on those same folds. If you try 50 regularization levels and pick the best-looking one, that best score has been cherry-picked, so it is almost certainly higher than reality.
The fix is to keep a separate test set untouched until the final step, or to nest an inner cross-validation loop used only for choosing parameters. The same logic applies to standardisation and feature selection: any step that learns from the data must run inside each fold, not beforehand on the whole table.
The second mistake is harder to spot: target leakage. Picture a churn prediction problem where the table contains a “contract cancellation date” column. That column only has a value once the customer has left, so the model gets nearly everything right in cross-validation and then collapses in production.
A habit worth building: before training, sit down with a domain expert and ask one question of every column: “at the moment we need to make the prediction, does this column already have a value?” A suspiciously good score is often the first sign of leakage.
Turning the reading into evidence for a job application
So turn the labs into a repo of your own: pick a public dataset, put the training-set score next to the cross-validation score, and write an explanation aimed at a non-technical manager.
On your CV, describe what you did in terms of results, for example “detected model overfitting using cross-validation”, rather than “studied ISLP”. When a job description asks for evaluating models on real data or explaining results to non-technical people, put that repo at the top of your application.
Frameworks will change many more times. But every client will ask whether a number can be trusted, and the three groups of chapters in the middle of this book help you answer.
Was this article useful?
Thanks for the feedback!