FDEs at electric utilities: learn a few industry concepts before joining GIS and SCADA data
A switch that shows "open" in one system and "closed" in another is usually not a bug, and an engineer who knows why will save weeks at the customer.

In brief
- At an electric utility, GIS stores the grid as designed and SCADA stores the grid as operated, so seeing the two disagree is common
- CIM (IEC 61970/61968) provides a shared vocabulary for grid objects, and the way it divides its scope hints at which data belongs to which team
- Reconcile and classify mismatches first, then build the object model, and only then the dashboard
In your first week at an electric utility you are handed three files: a GIS export, a list of SCADA measurement points and an asset register. The task sounds simple: join the three files to draw one feeder. By the afternoon you notice a switch that is open in one file and closed in another, and nobody in the meeting room is surprised.
Nobody is surprised because this is not a random error but a structural feature of the industry. A 2016 report on ADMS published by PNNL concluded that the data models in utilities’ GIS are often incomplete, inaccurate, or both, and identified integration between operational systems as the biggest challenge in deployment.
You can arrive at a utility thinking “if there’s a schema, I can join it”, and then spend two weeks fixing things that were never broken. The alternative is to learn a few industry concepts in advance so that you ask the right questions from the very first discovery session.
GIS and SCADA do not describe the same state
GE Vernova describes this split neatly. On one side are the grid design and mapping teams: they use GIS to plan and update the normal state of the grid, in their own silo. On the other side are the control-room operators: they monitor the real-time state in a different silo.
So GIS answers the question “how is the grid designed to operate”, while SCADA answers “how is the grid operating right now”. When an operator isolates a section for repairs or to transfer load, it is correct for the two to differ. Other mismatches really are errors: GIS has not been updated, or the ID mapping table is wrong.
1Spatial describes a typical case from the utilities sector: GIS shows a valve as closed while SCADA reports it as open. At an electric utility, swap “valve” for “switch” and you have exactly that afternoon’s situation.
CIM gives you a vocabulary before you write a schema
The power industry has had a common language for a long time. CIM, under the IEC 61970-301 standard, is an abstract information model describing the main objects in an electric utility enterprise. It represents power system resources as classes of objects with attributes, so that applications developed independently by different vendors can still integrate with each other.
For an FDE, the most useful part of CIM is how it divides its scope. According to the CIM Users Group, IEC 61970 covers power system modelling and data exchange, including EMS, topology, conductors and SCADA. IEC 61968 handles models related to the distribution network: DMS, assets, work, GIS, metering and messaging between applications.
Your customer may not implement CIM to the letter, but the division is still worth using as a map. It gives you a list of nouns to use when talking to power engineers.
It also suggests which data probably belongs to which team: operations, or assets and mapping. When a data field looks absurd, knowing who owns it is half the problem solved.
Example: reconciling a feeder
Picture a feeder with 40 switches. GIS uses asset IDs such as SW-0412, with an extra field for the normal state. SCADA uses tag names such as F07_SW412_POS, where a value of 1 means closed. Neither system holds the other’s key, so the first job is to build a crosswalk table mapping asset IDs to tags.
Next, bring each device into a single object in which the two states are kept separate, right down to the field names:
from dataclasses import dataclass

@dataclass
class Switch:
    asset_id: str               # key from GIS
    scada_tag: str | None       # taken from the crosswalk table
    normal_open: bool           # designed state (GIS)
    measured_open: bool | None  # measured state (SCADA)

def classify(sw: Switch, switching_orders: set[str]) -> str:
    if sw.scada_tag is None or sw.measured_open is None:
        return "missing_link"
    if sw.normal_open == sw.measured_open:
        return "match"
    if sw.asset_id in switching_orders:
        return "intentional_switching"
    return "needs_field_check"
The switching_orders parameter is the list of devices with recent switching orders, and you have to request it from the control room. Without it, every legitimate load transfer will be counted as an error.
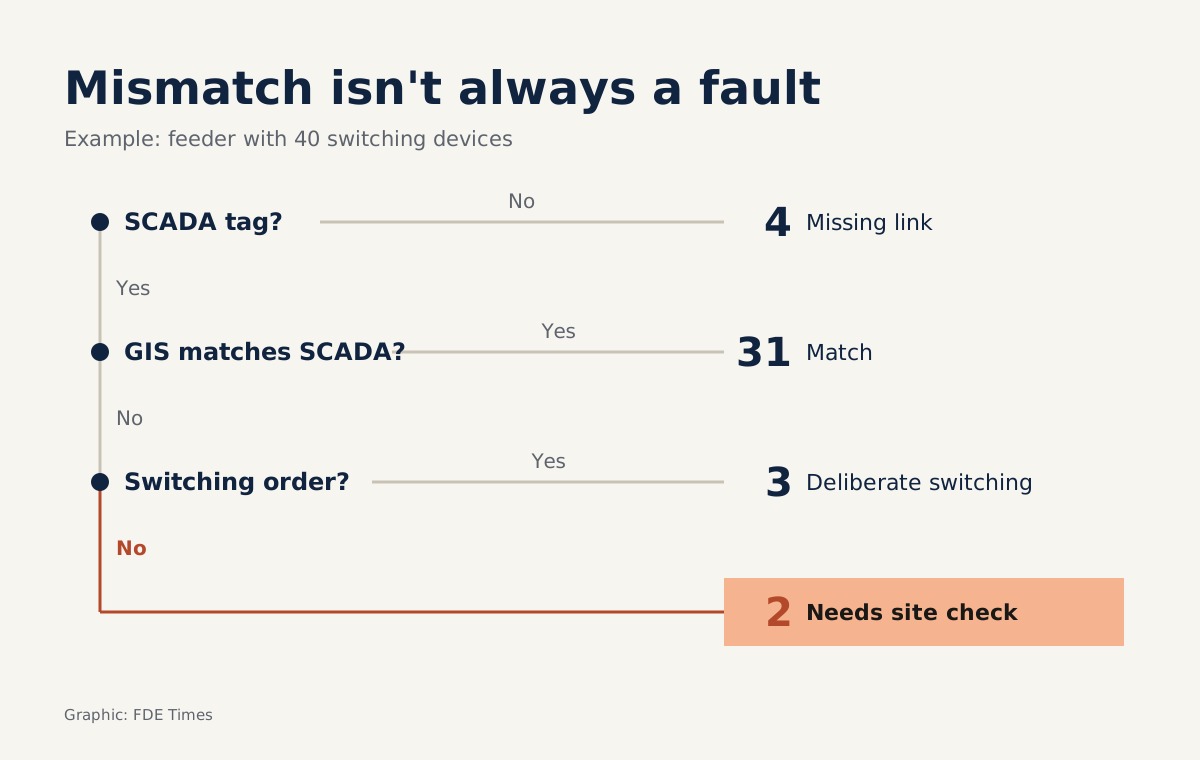
Suppose the run gives 31 matching devices, 4 missing links, 3 mismatches due to intentional switching and 2 needing a field check. Instead of reporting “GIS is wrong in 9 places”, you bring three lists to three different people.
The four missing links are a job for you and the integration team. The last two belong to the mapping team, and someone may have to go out to the pole itself.
The object model comes before the dashboard
Palantir has described a case study with a European utility. Its geographic asset system and its grid system were separate, so the company lacked a complete, up-to-date picture of the state of its grid. The solution was to model the grid topology as Ontology objects and views representing each network element.
The lesson does not depend on the tool. Devices, lines and connectivity must first become explicit objects. Dashboards or forecasting models come afterwards. If you build charts on a join that has not been reconciled, you are only drawing the existing mismatches more attractively.
The sequence at the customer is therefore fairly clear:
- Place each system within the 61970 or 61968 scope and write down its owner.
- Ask whether each state field is “normal” or “measured”.
- Build the ID crosswalk between asset IDs and SCADA tags.
- Run the classification step, then hand each list of mismatches to the right team.
- Lock the object model only once both the mapping team and the control room have confirmed it.
The familiar traps
The most common trap is treating GIS as the source of truth and overwriting it with the SCADA state, or the reverse. The two fields describe different things, so keep both. The second trap is assuming a device has only one ID, when each silo usually assigns codes in its own way.
The third trap is harder to spot: using generic software language with power engineers. Ask “is this record stale?” and they will struggle to answer. Ask “is this the normal state or the measured state?” and they can answer immediately. Using their vocabulary is the fastest way to earn their trust.
On the career side, use the terms in this article (CIM, IEC 61968/61970, ADMS, GIS, SCADA) as a checklist when reading FDE job descriptions in the energy sector. On your CV, don’t just write “data integration”.
Say specifically which systems you reconciled topology between and how you classified the mismatches. The PNNL report identifies integration between operational systems as the biggest challenge, so this is experience worth putting at the top.
At an electric utility, the person who understands why two files don’t match is worth more than the person who can join them.
Was this article useful?
Thanks for the feedback!
6 sources
- Energy management system application program interface (EMS-API) – Part 301: Common information model (CIM) base · 2020
- About CIMUG - CIM Users Group
- ADMS State of the Industry and Gap Analysis · 2016-03-31
- Network-Based GIS and ADMS Integration: A Shared Source of Truth · 2025-08-19
- Unifying Utility Data Silos
- Improving decision-making through holistic power grid network modeling